
Bathtub Curve
In stock
$5.00
item details (5 Editable Slides)
- Applications Supported: PowerPoint, Google Slides
- File Type: .pptx, Google Slides
- Aspect Ratio:16:9 (Wide Screen)
- Animation: Yes
Bathtub Curve
Bathtub Curve
(5 Editable Slides)
Related Products

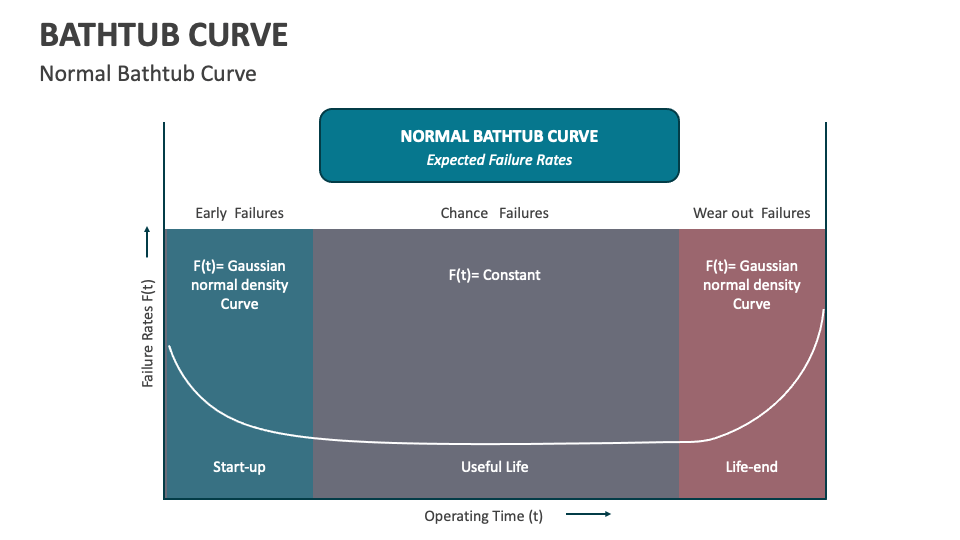
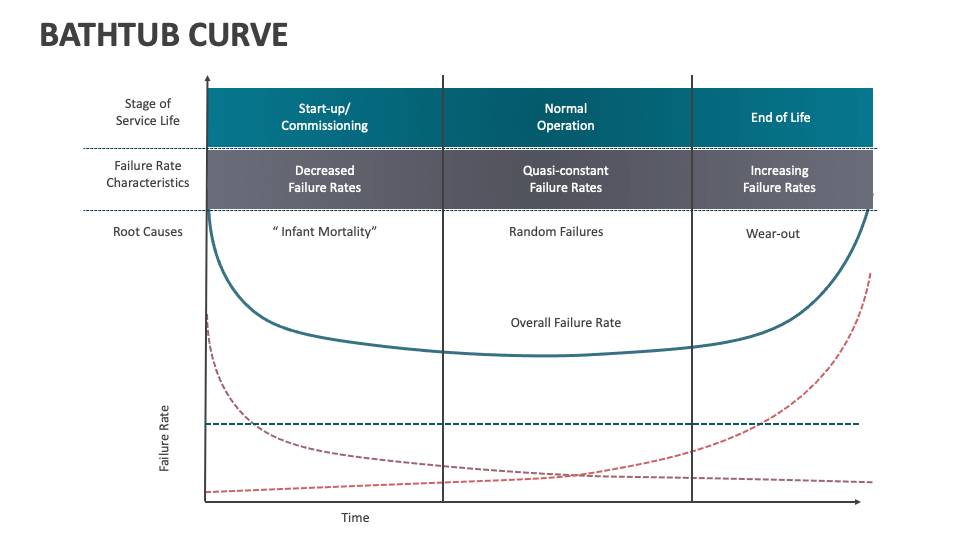
We have introduced the Bathtub Curve presentation template for MS PowerPoint and Google Slides to help you visualize the reliability engineering concept illustrating the failure rate of a product over time. These high-quality illustrations will take your slideshow to the next level. Get them without any further delay!
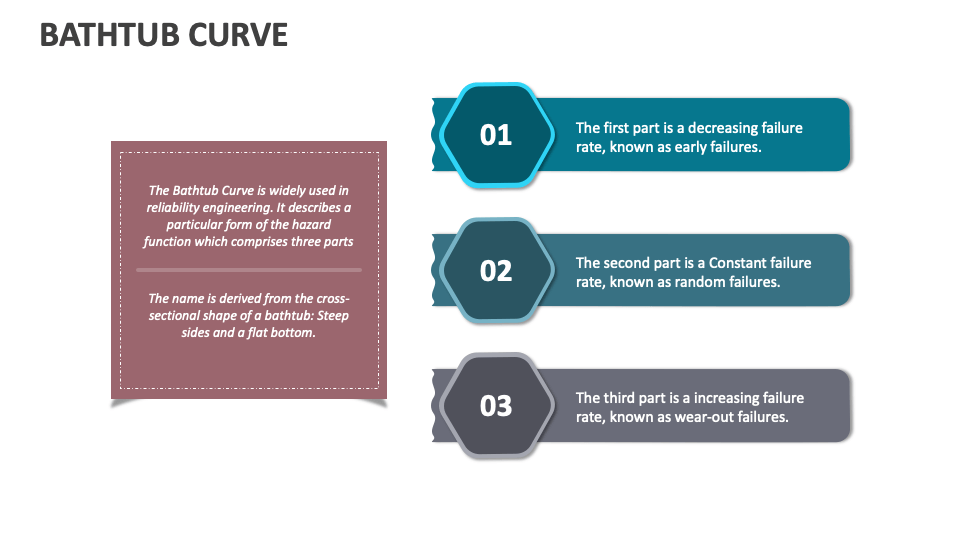
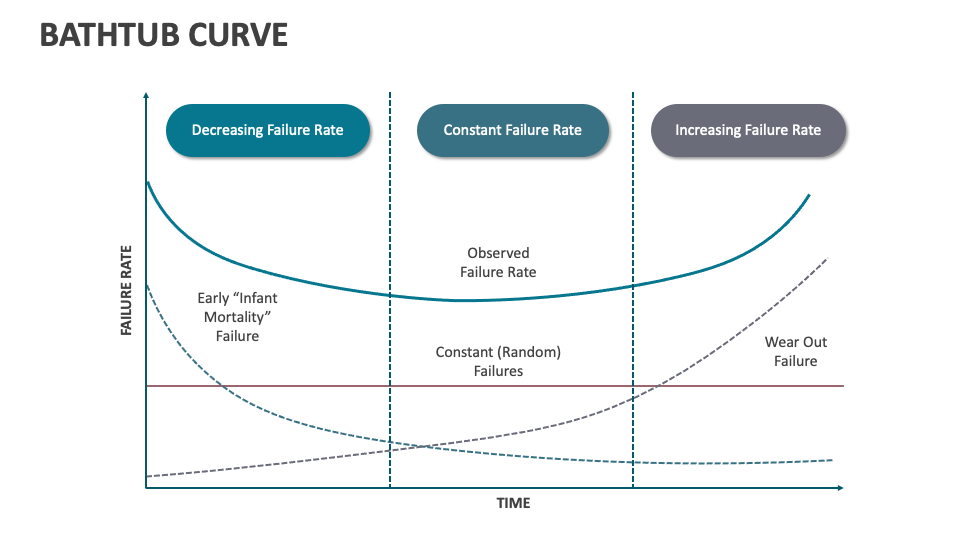
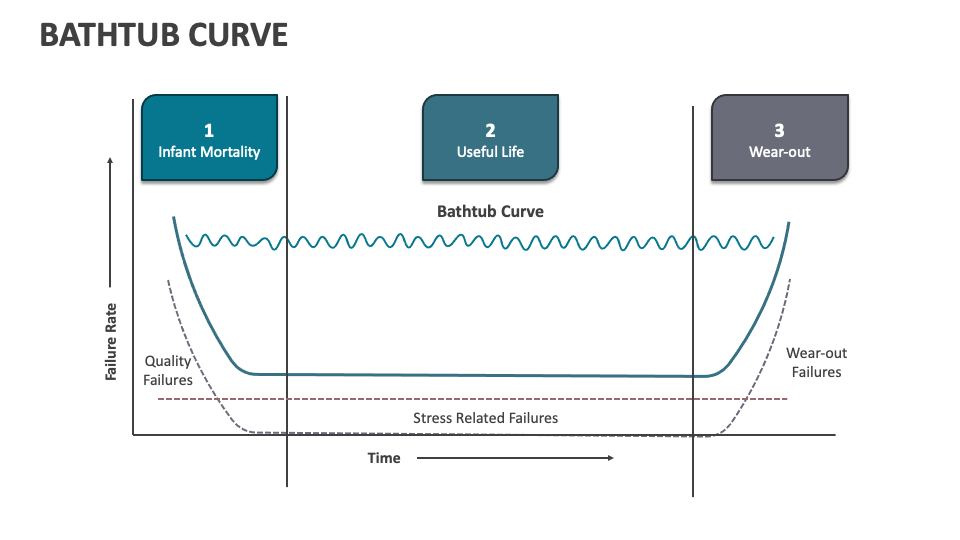
Product managers can use this set to depict how this curve is crucial in designing and maintaining reliable systems. You can explain three phases of this curve an initial high failure rate (early failures), followed by a period of low failure rates (chances failures), and a final phase with an increasing failure rate (wear-out failures). With this PPT, you can present a graphical representation of your product’s service life stages, failure rate characteristics, and root cause of failure.