
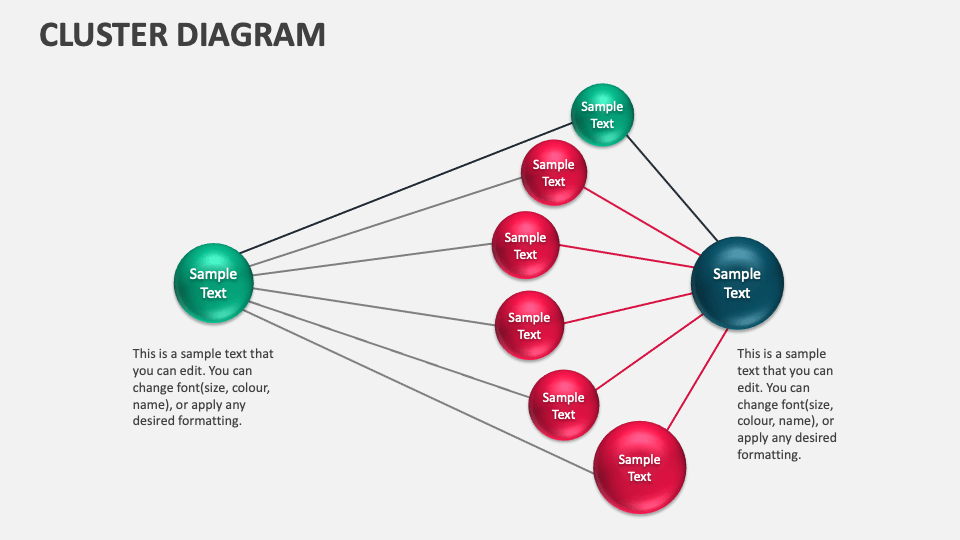
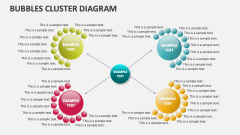
Cluster Diagram
In stock
$5.00
item details (9 Editable Slides)
- Applications Supported: PowerPoint, Google Slides
- File Type: .pptx, Google Slides
- Aspect Ratio:16:9 (Wide Screen)
- Animation: Yes
Cluster Diagram
Cluster Diagram
(9 Editable Slides)
Related Products


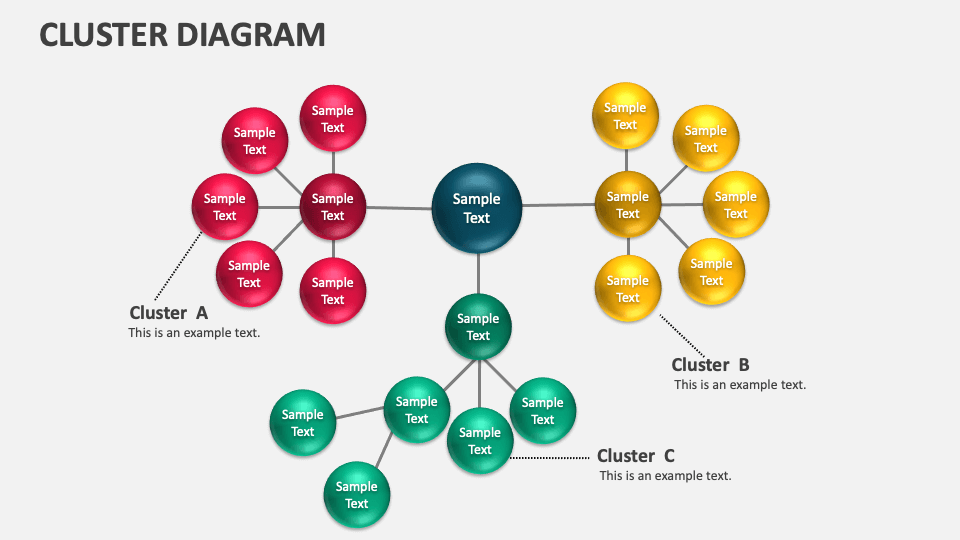
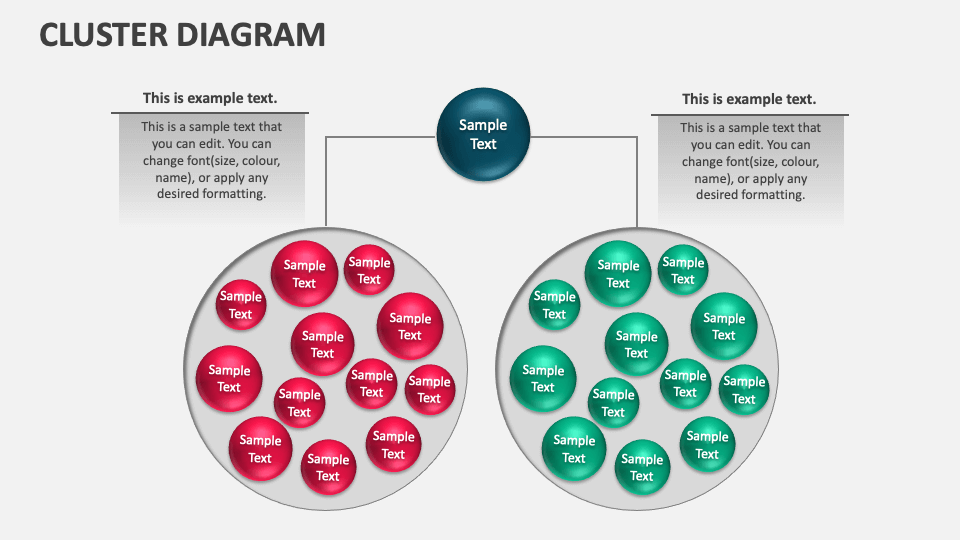
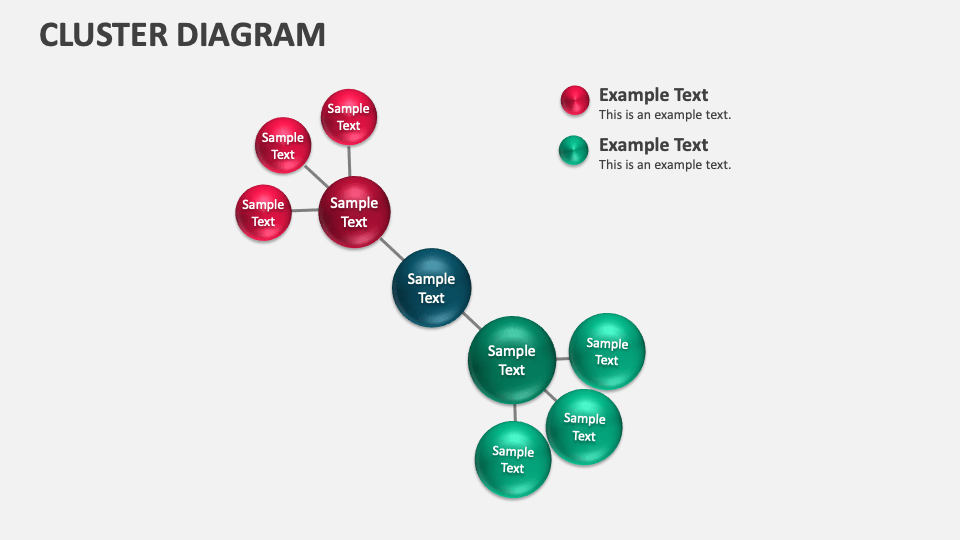
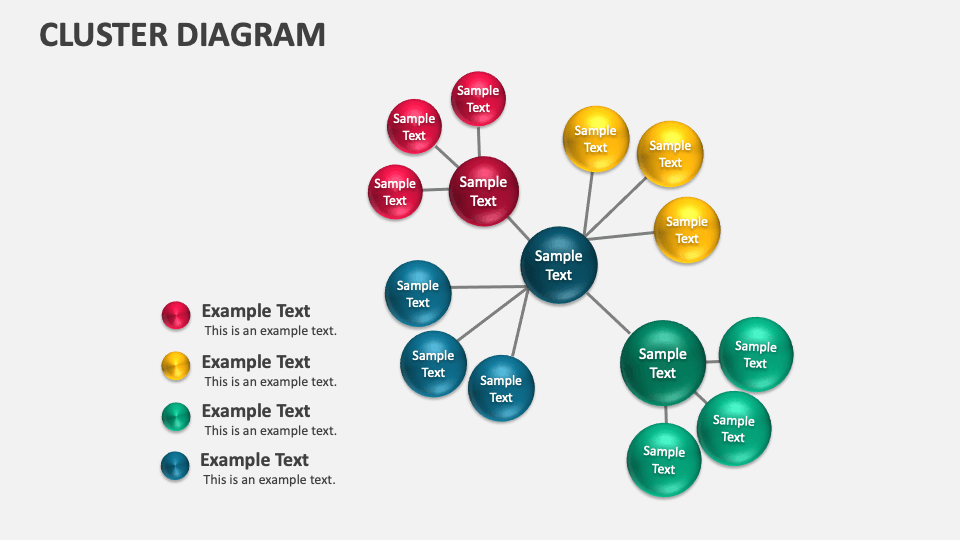
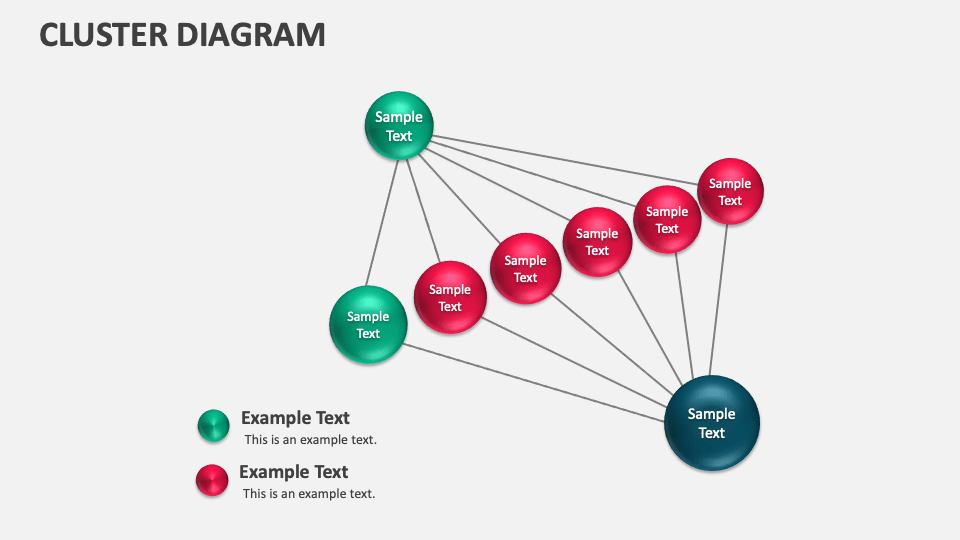
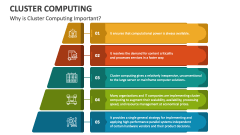
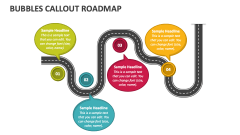
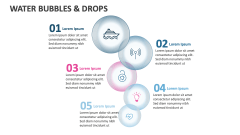
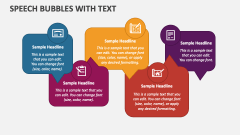
Our Cluster Diagram for MS PowerPoint and Google Slides is an ideal visual aid for depicting the relationships and connections between various concepts, a core idea and multiple sub-ideas supporting it, company networks, and more. Adequate space is available for text insertion, allowing you to present personalized content seamlessly.
Marketing heads can use this template to showcase sales strategies and their elements, product promotion channels and networks, customer segments based on various factors, and more. HR heads can use these visuals to visualize the hierarchical relationships within the company. IT heads can highlight the overall system architecture and the relationships and data flows between different system components.