
Gauge Chart
In stock
$5.00
item details (1 Editable Slide)
- Applications Supported: PowerPoint, Google Slides
- File Type: .pptx, Google Slides
- Aspect Ratio:16:9 (Wide Screen)
- Animation: Yes
Gauge Chart
Gauge Chart
(1 Editable Slide)
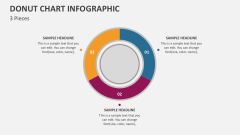
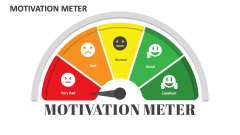
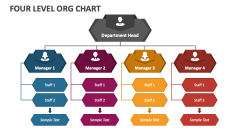
Related Products
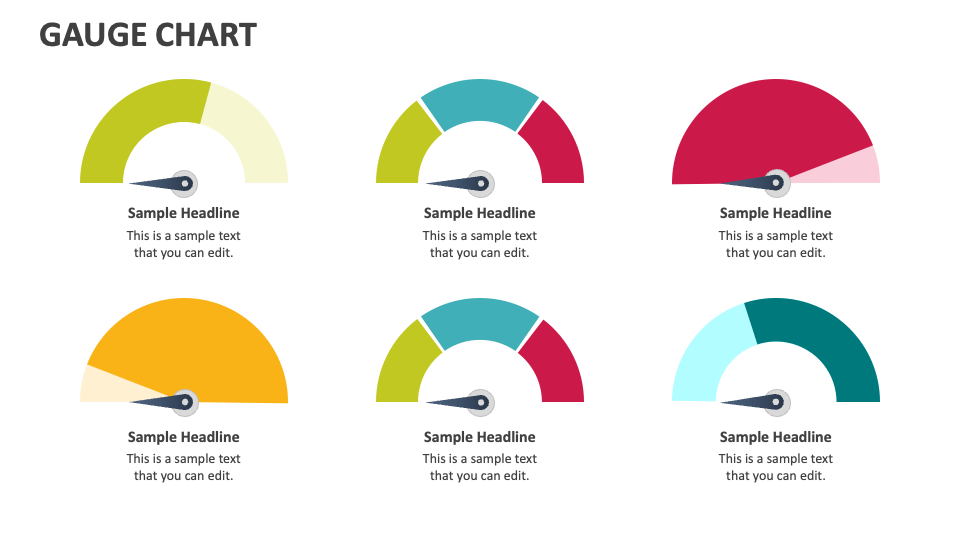
Get your hands on our innovative Gauge Chart Powerpoint slide to describe the systematic visualization process used for displaying data value with a quantitative context.
Business leaders, entrepreneurs, and professionals from various domains can leverage the Powerpoint slide to illustrate the level of risk, performance of an employee, response of customers towards the company’s products, speed of the organization’s digital transformation, etc.