
Matrix Chart
In stock
$5.00
item details (12 Editable Slides)
- Applications Supported: PowerPoint, Google Slides
- File Type: .pptx, Google Slides
- Aspect Ratio:16:9 (Wide Screen)
- Animation: Yes
Matrix Chart
Matrix Chart
(12 Editable Slides)

Related Products
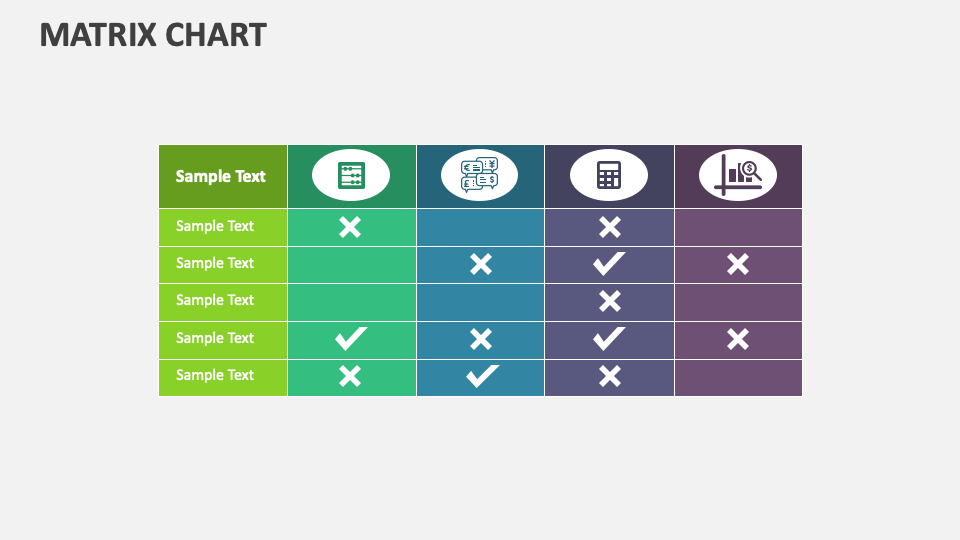
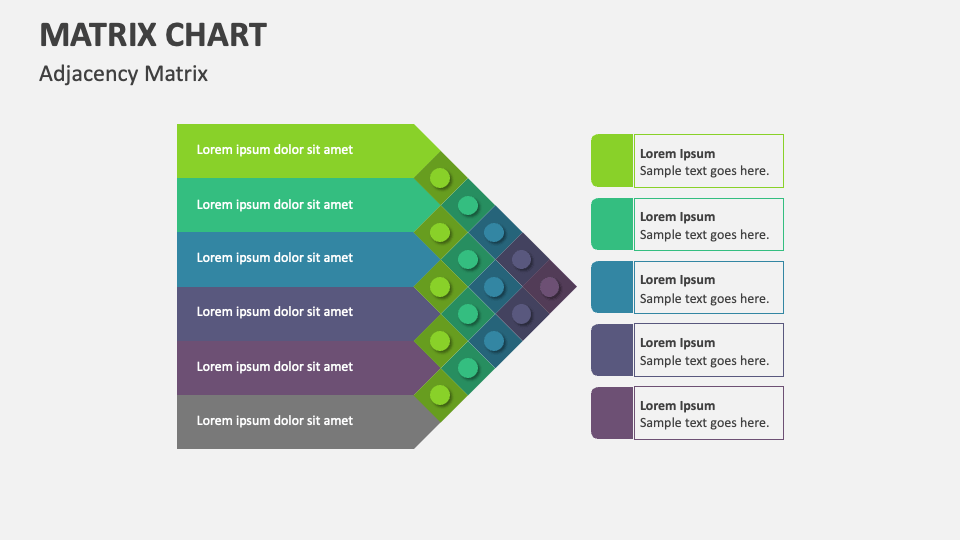
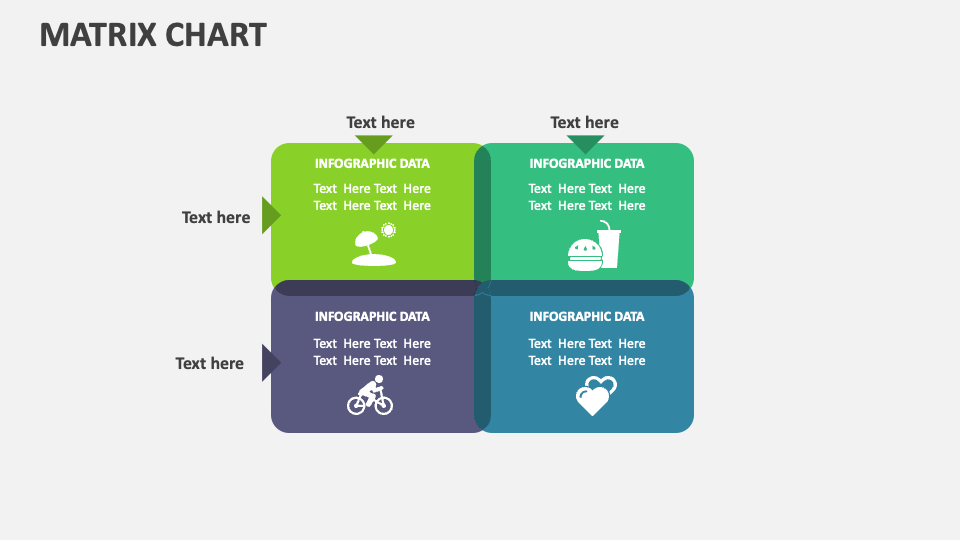
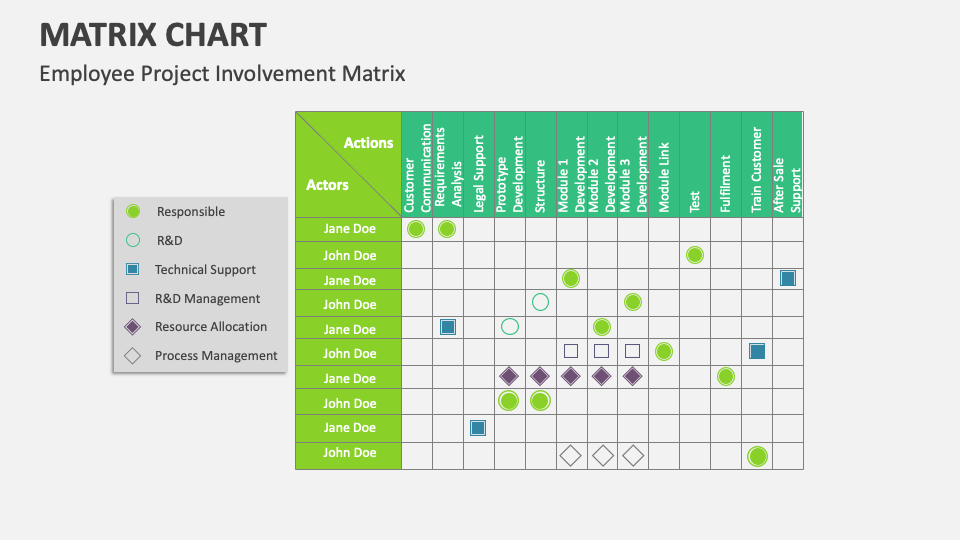
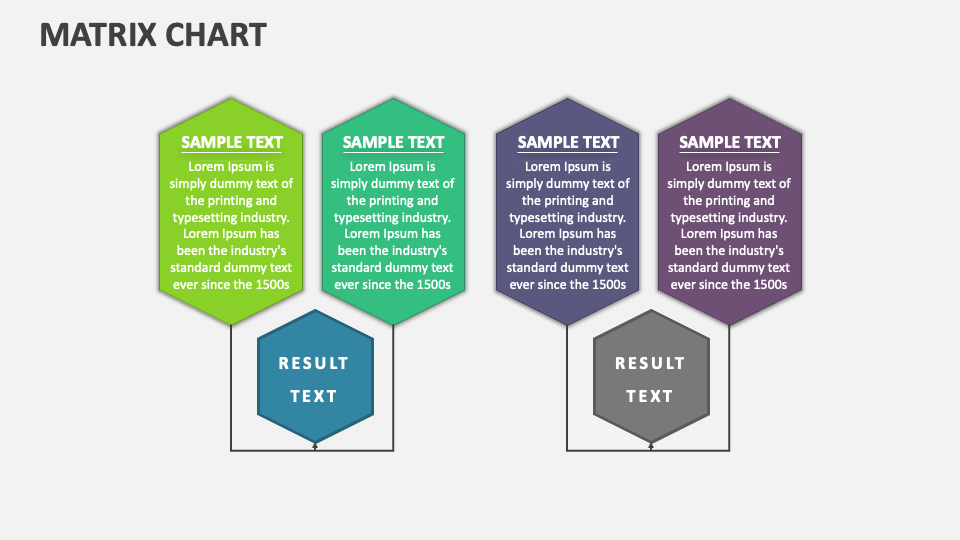
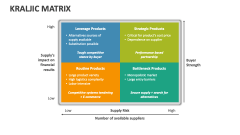
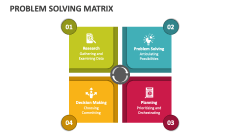
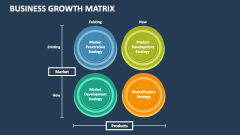
Present the comparison of various data sets or their interrelationships in an attention-grabbing manner with the help of our fabulous Matrix Chart for MS PowerPoint and Google Slides. Download this multipurpose template to communicate effectively with your audience!
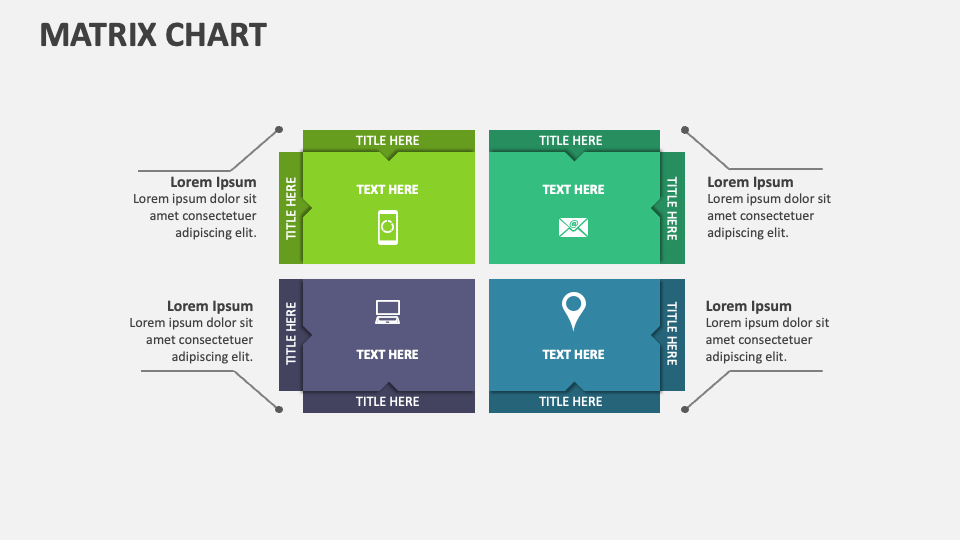
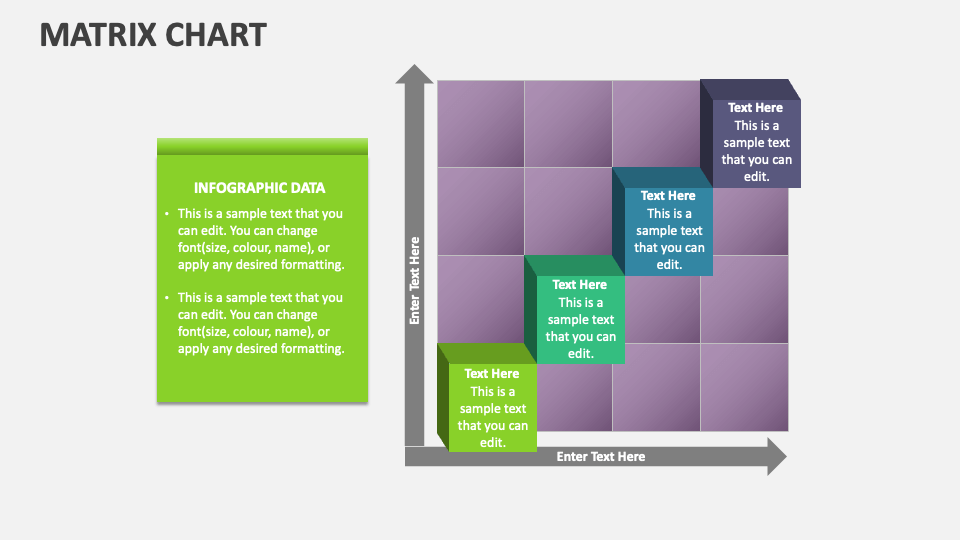
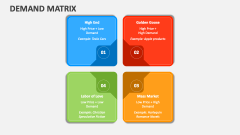
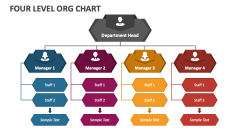
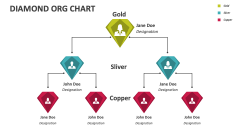
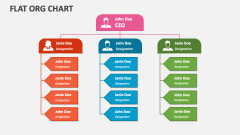
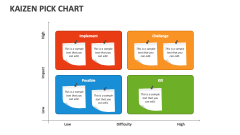
Business leaders can showcase the product categories of the BCG matrix, i.e., Stars, Cash Cows, Question Marks, and Dogs. Project heads and senior executives can use this PPT to illustrate the quadrants of the benefit-efforts matrix based on rewards and efforts. Senior managers can showcase the importance of the PICK chart in helping evaluate and categorize tasks, decisions, etc., based on their feasibility and impact. Professionals from diverse domains can demonstrate a 3*3 matrix depicting product features against customer requirements, performance metrics for different departments, project tasks against key objectives, etc.