
Pie Chart Infographics
In stock
$5.00
item details (8 Editable Slides)
- Applications Supported: PowerPoint, Google Slides
- File Type: .pptx, Google Slides
- Aspect Ratio:16:9 (Wide Screen)
- Animation: Yes
Pie Chart Infographics
Pie Chart Infographics
(8 Editable Slides)
Related Products

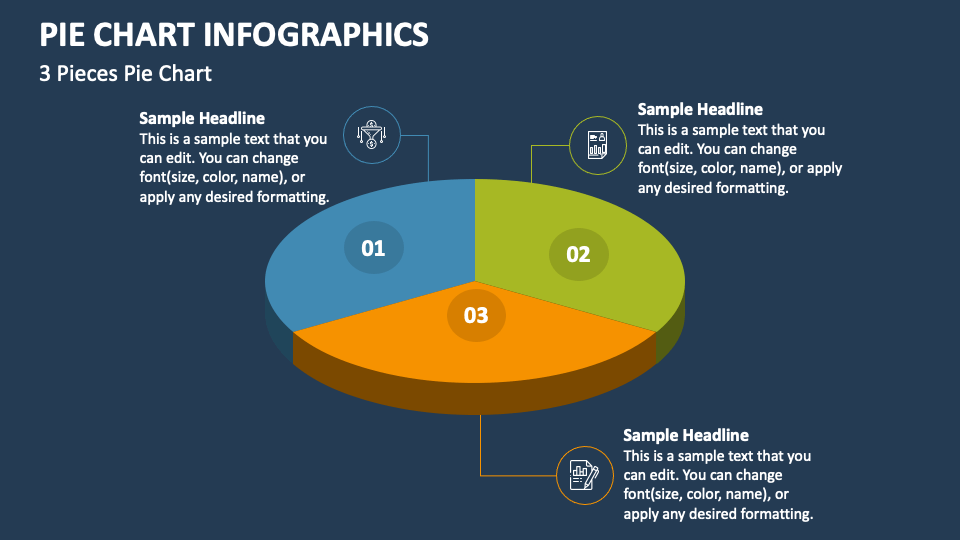
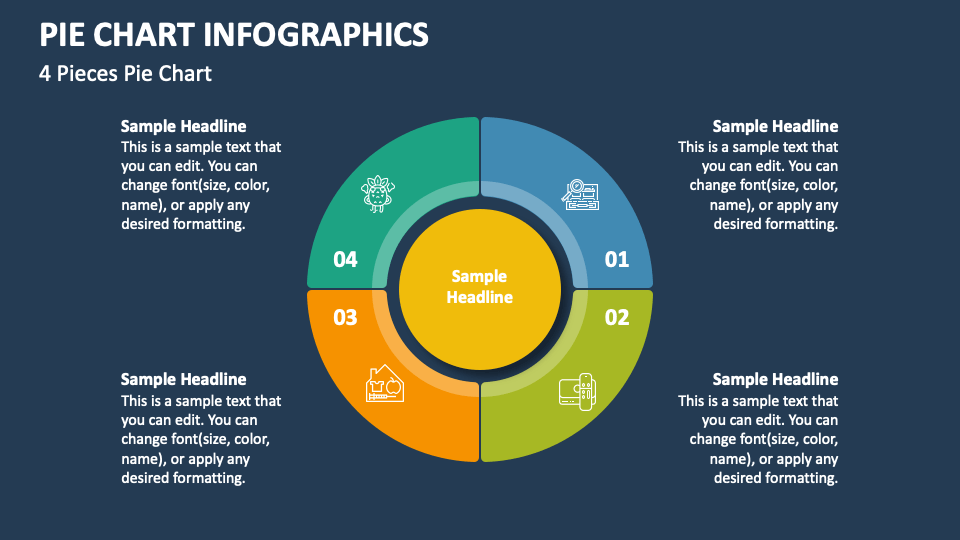
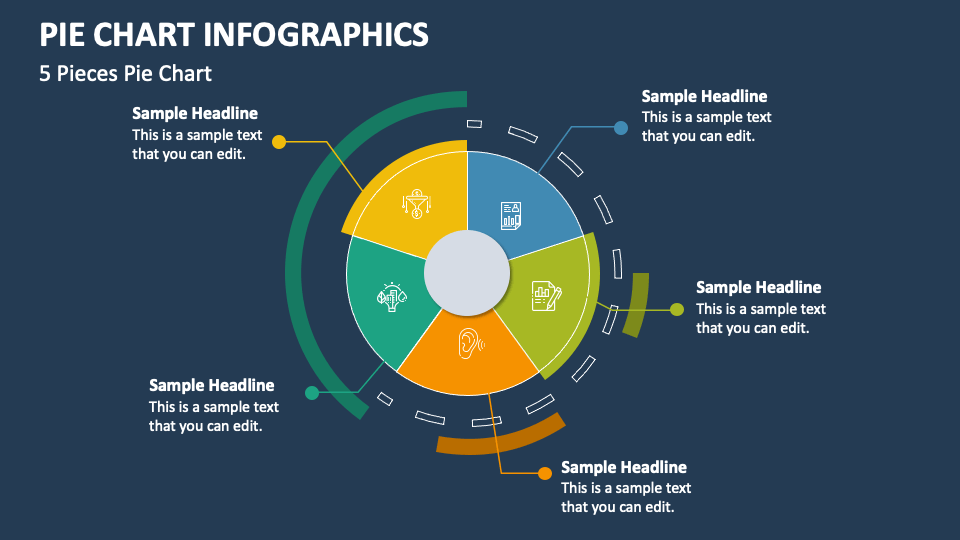
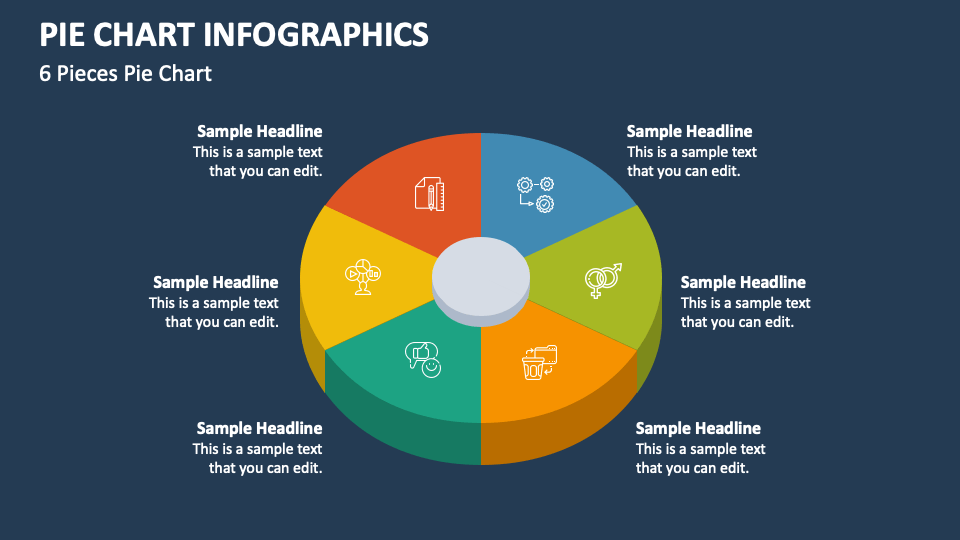
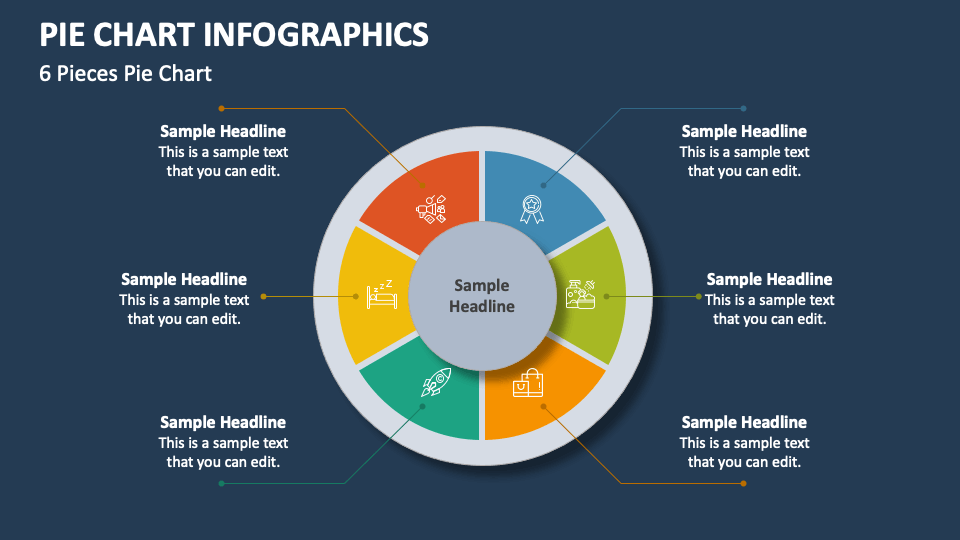
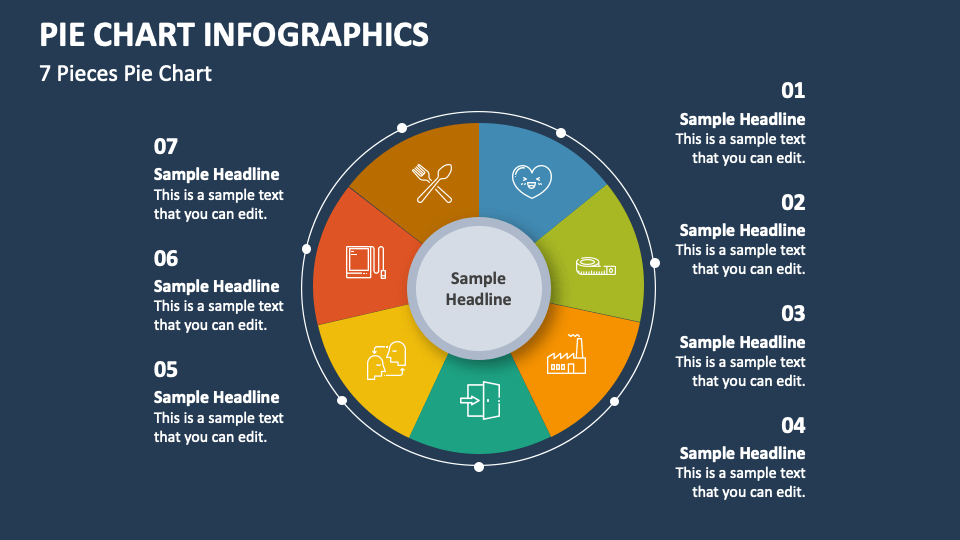
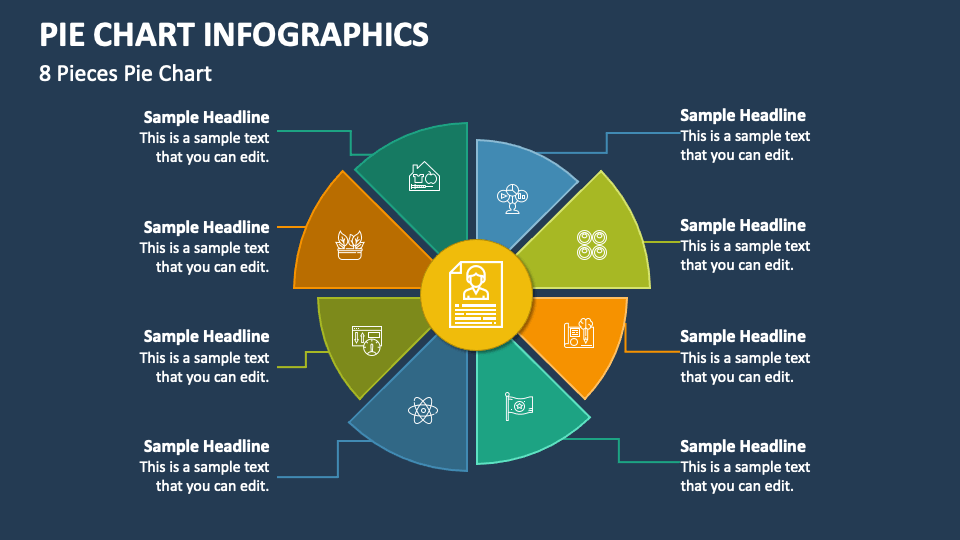
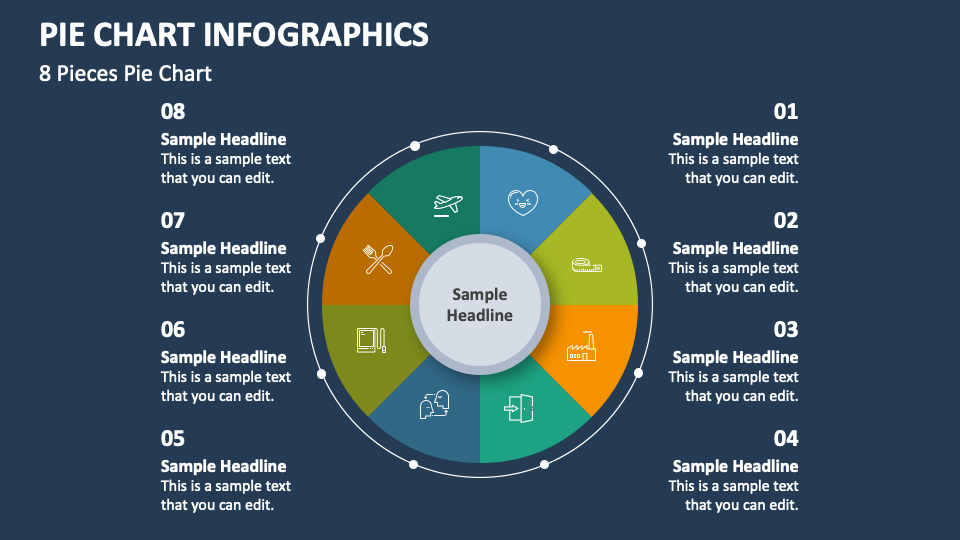
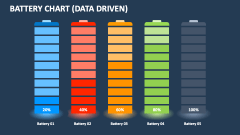
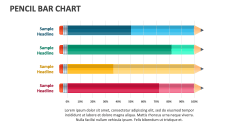
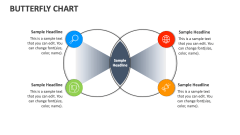
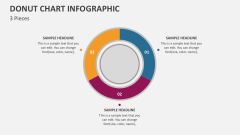
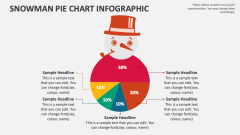
We have come up with the Pie Chart Infographics presentation template for MS PowerPoint and Google Slides to help you depict statistical or numerical-based data in an easy-to-understand manner. You can also use these graphics to depict topics about proportions, percentages, or distributions of data to the intended audience.
Business owners can shed light on the breakup of their overall revenue, budget allocations for different departments in the company, market share, and more. Sales managers can utilize this PPT to illustrate the percentage contribution of each branch/location to the overall sales figures, conversion rates at different stages of the sales process, etc. HR heads can demonstrate the distribution of benefits provided to employees, i.e., healthcare, retirement plans, bonuses, etc.