
Scatter Plot (Data Driven)
In stock
$5.00
item details (7 Editable Slides)
- Applications Supported: PowerPoint, Google Slides
- File Type: .pptx, Google Slides
- Aspect Ratio:16:9 (Wide Screen)
- Animation: Yes
Scatter Plot (Data Driven)
Scatter Plot (Data Driven)
(7 Editable Slides)
Related Products
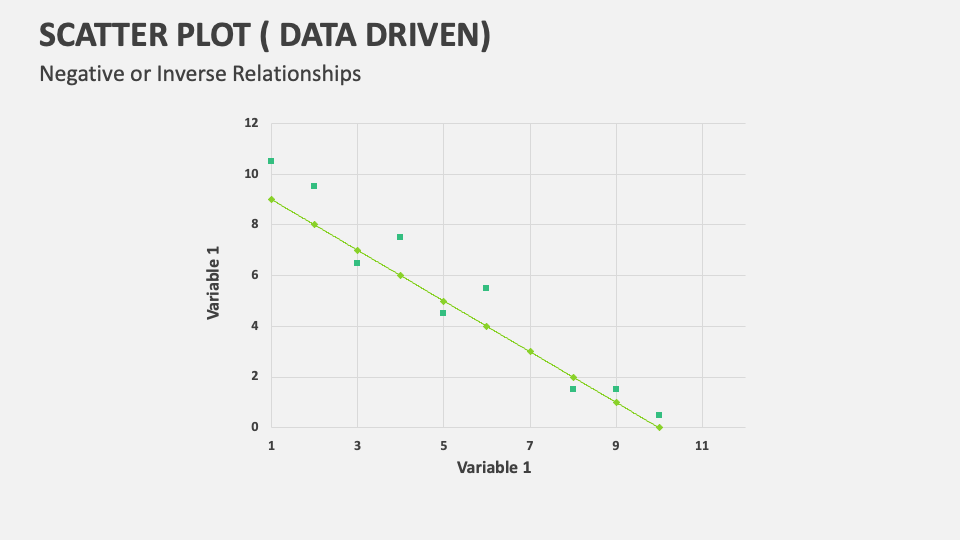
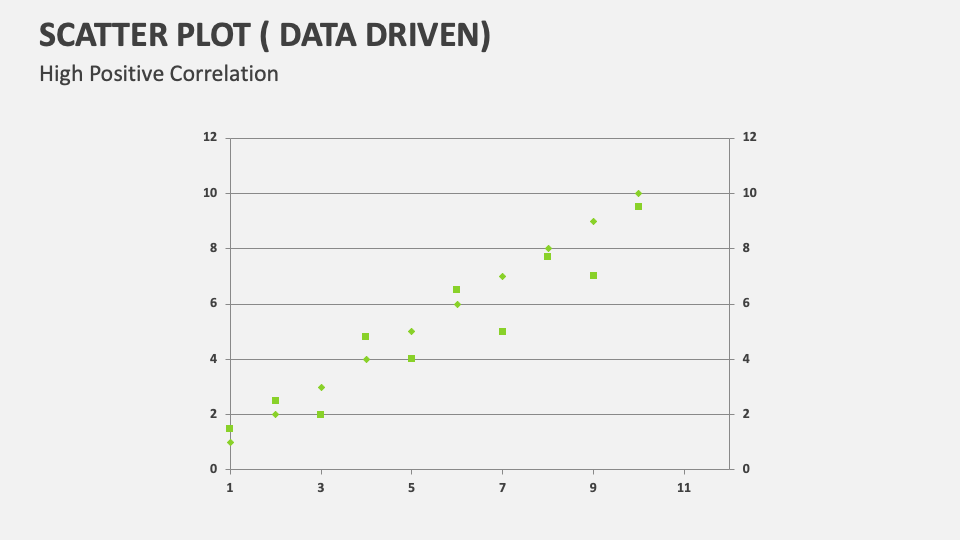
If you wish to present the correlations, patterns, trends, and relationships between variables and data sets in a visually engaging manner, download our Scatter Plot (Data Driven) presentation template without a second thought. Designed for MS PowerPoint and Google Slides!
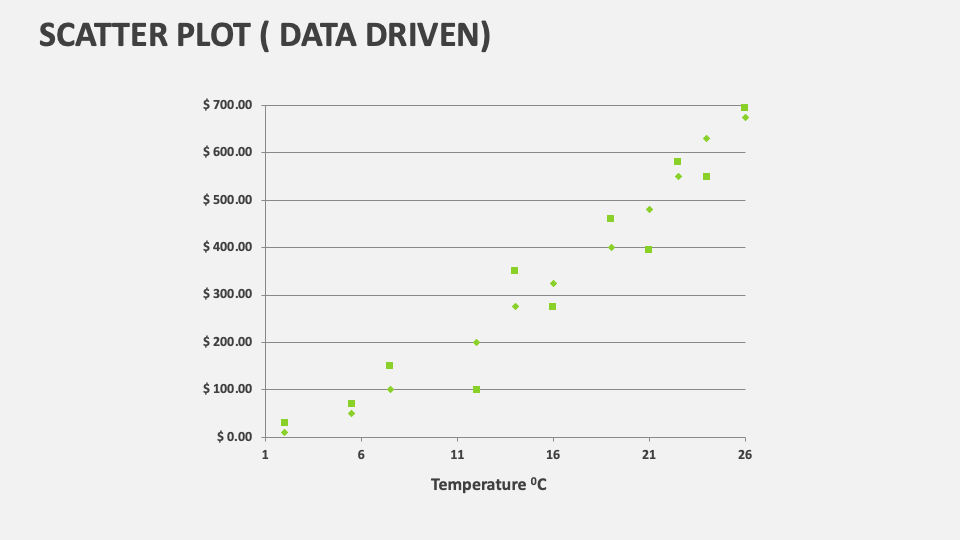
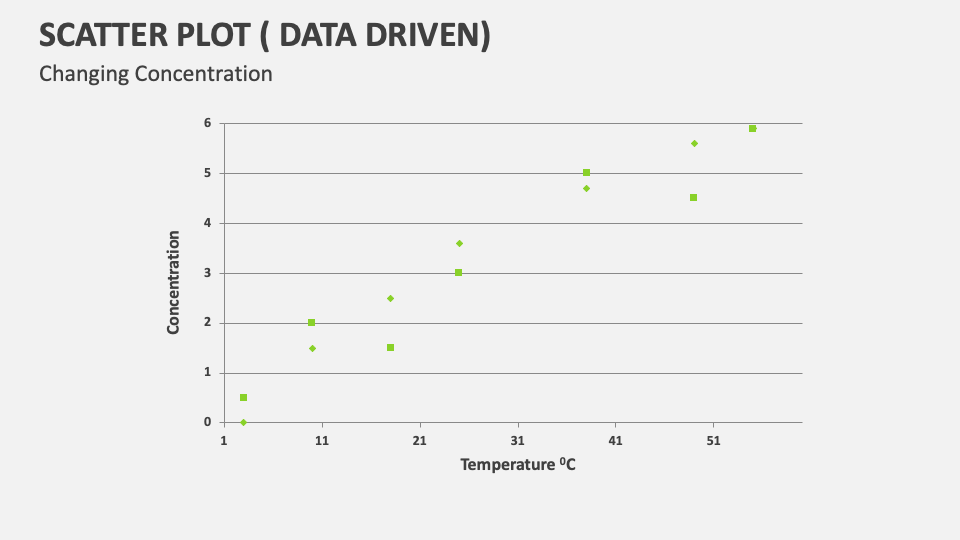
Business owners and financial heads can leverage this PPT to showcase the relationship between a company’s revenue and profit margins. Sales heads can include these slides in their presentations to explain how customer satisfaction varies with changes in product pricing. Investment experts can visualize different investment options based on their risk levels and returns. Educators can highlight the linear progression of the change in the concentrations of various elements/compounds with temperature.