
Actual Vs Forecast Infographic
In stock
$5.00
item details (7 Editable Slides)
- Applications Supported: PowerPoint, Google Slides
- File Type: .pptx, Google Slides
- Aspect Ratio:16:9 (Wide Screen)
- Animation: Yes
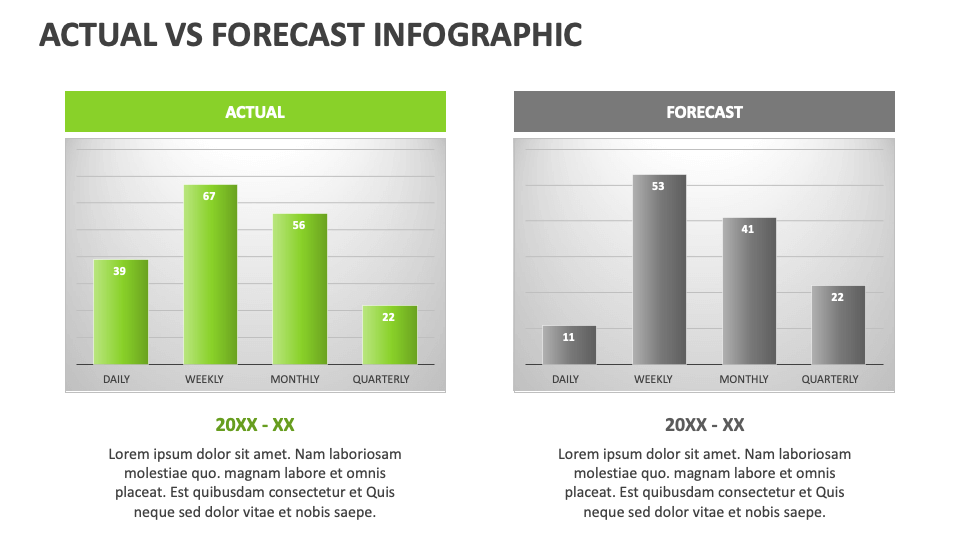
Actual Vs Forecast Infographic
Actual Vs Forecast Infographic
(7 Editable Slides)


Related Products
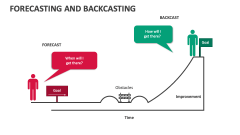
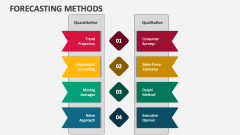
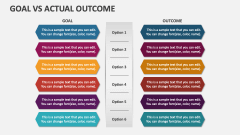
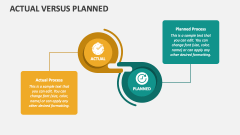
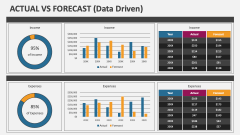
We have introduced the Actual vs. Forecast Infographic for MS PowerPoint and Google Slides to help you present your textual content in a manner that is both engaging and comprehensible for the audience. Get this deck right away!
Sales heads can use this engaging deck to visualize the comparison between current sales revenue and projected estimates. Financial experts can highlight the comparison of actual financial outcomes with forecasted results. Business leaders can showcase a comparative analysis of actual versus projected revenue figures. Digital marketing managers can leverage these multipurpose slides to present information about actual website traffic and user conversion rates against projected figures.