
Actual Vs Forecast (Data Driven)
In stock
$5.00
item details (6 Editable Slides)
- Applications Supported: PowerPoint, Google Slides
- File Type: .pptx, Google Slides
- Aspect Ratio:16:9 (Wide Screen)
- Animation: Yes
Actual Vs Forecast (Data Driven)
Actual Vs Forecast (Data Driven)
(6 Editable Slides)

Related Products
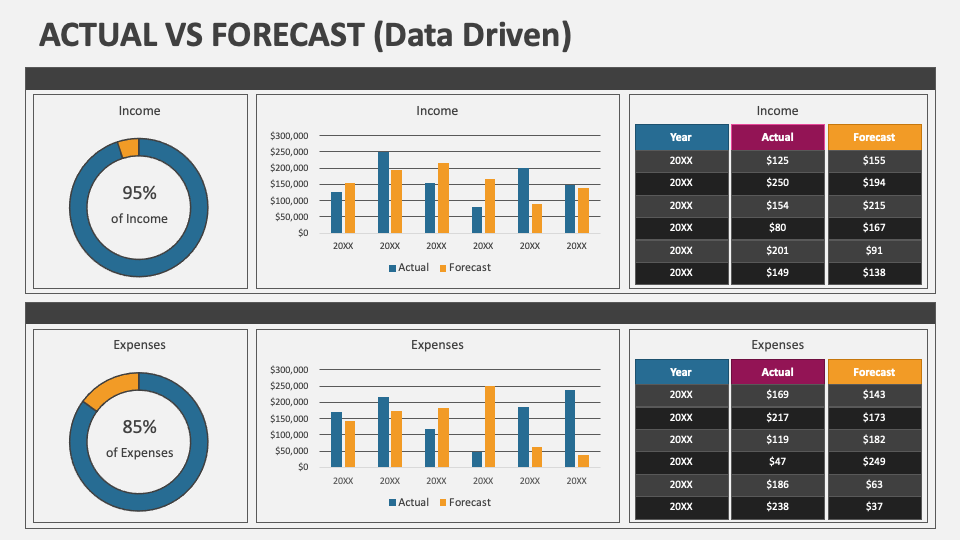
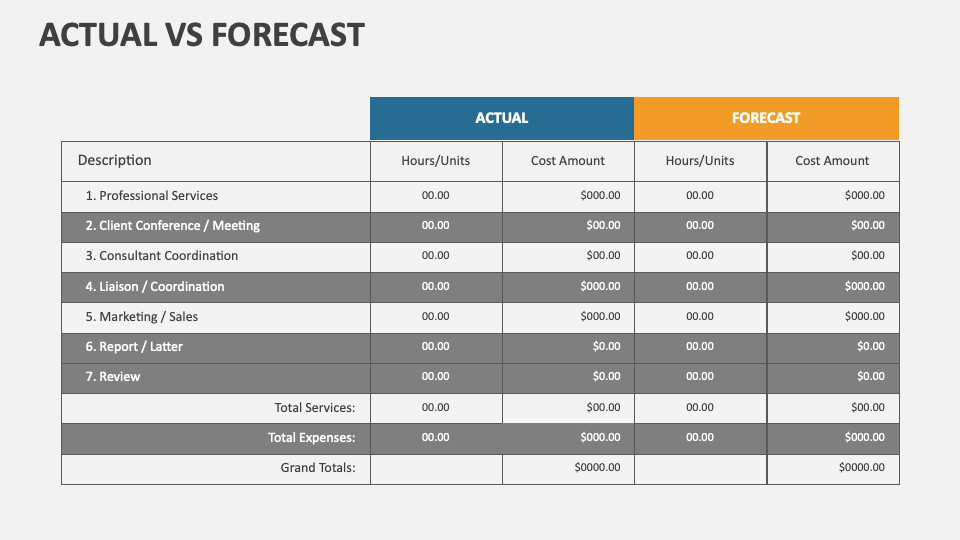
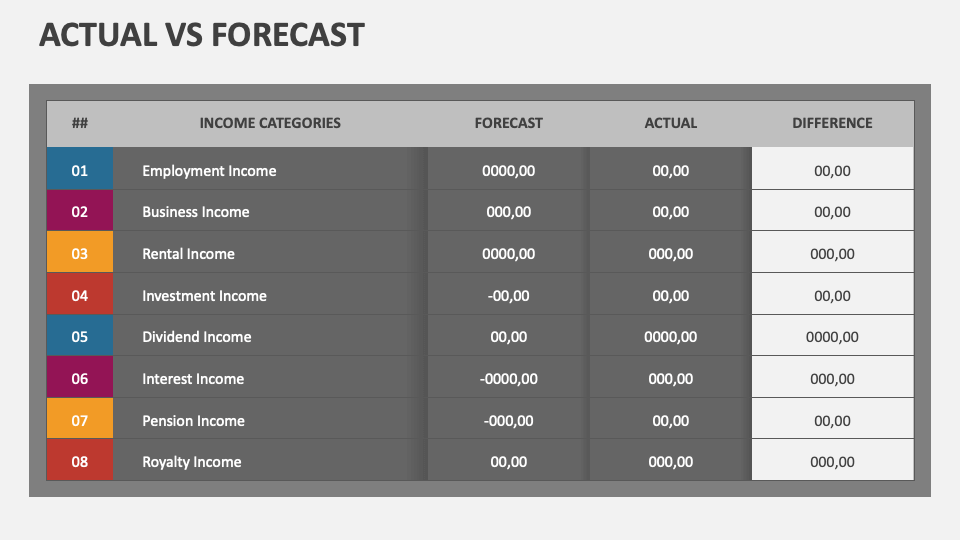
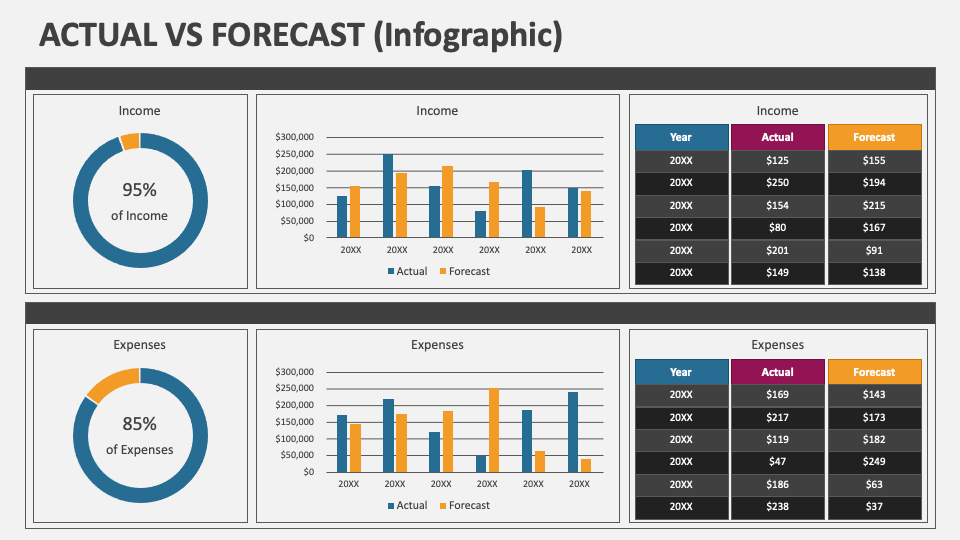
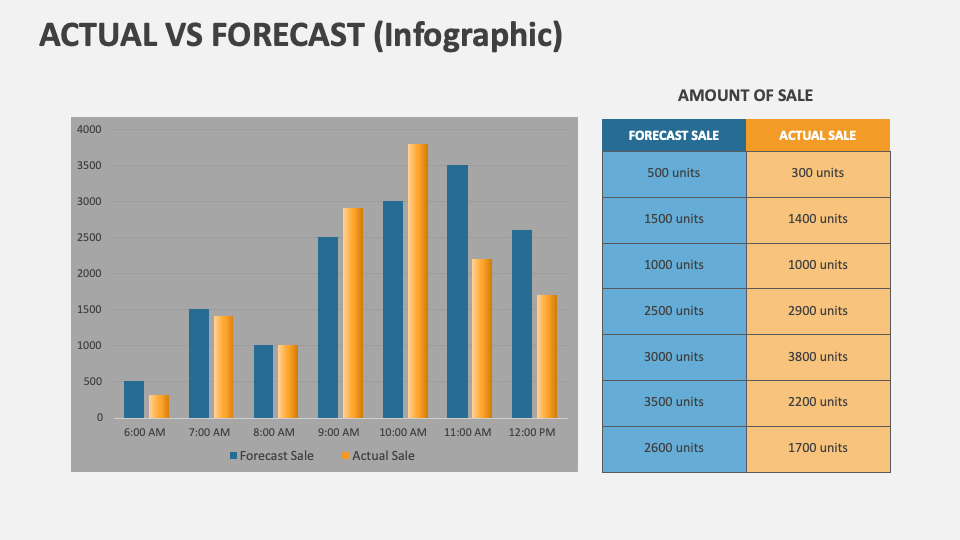
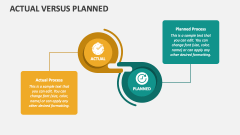
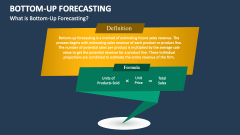
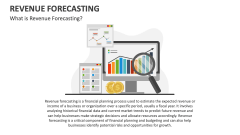
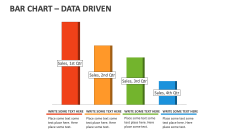
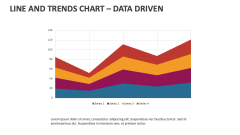
We have designed the Actual vs. Forecast presentation template for MS PowerPoint and Google Slides to help you showcase a comparative analysis of real outcomes (actuals) and predicted values (forecasts) in a project, business process, or other context. Download the deck right away!
Business professionals can use this set to present a comparative analysis of actual sales figures/business revenue and forecasted numbers. Project managers can shed light on the comparison between actual outcomes and forecasted results related to a project. Supply chain managers can depict the differences between the actual and forecasted inventory levels or quantities. You can also illustrate the common causes of variances between actuals and forecasts and strategies for effectively identifying and addressing these gaps.