
Bar Chart (Data Driven)
In stock
$5.00
item details (8 Editable Slides)
- Applications Supported: PowerPoint, Google Slides
- File Type: .pptx, Google Slides
- Aspect Ratio:16:9 (Wide Screen)
- Animation: Yes
Bar Chart (Data Driven)
Bar Chart (Data Driven)
(8 Editable Slides)
Related Products
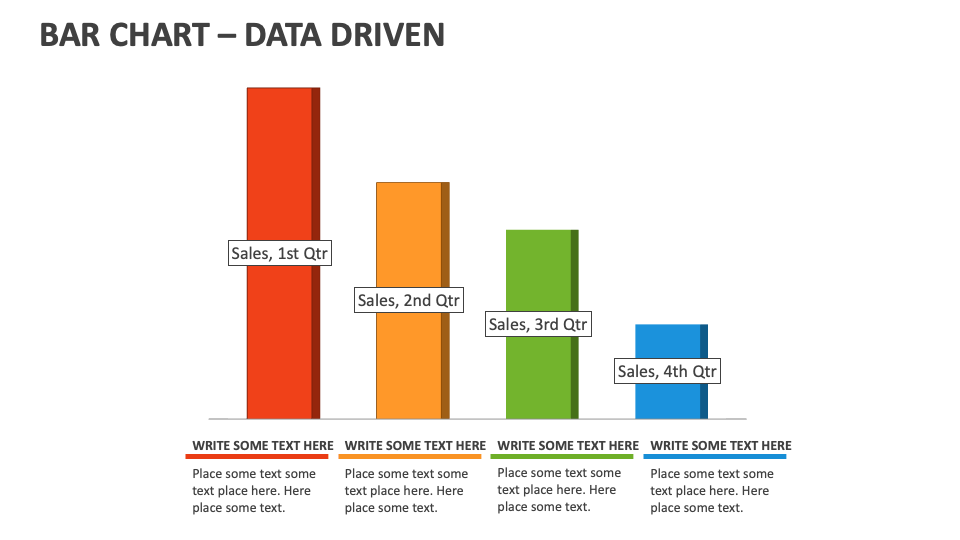
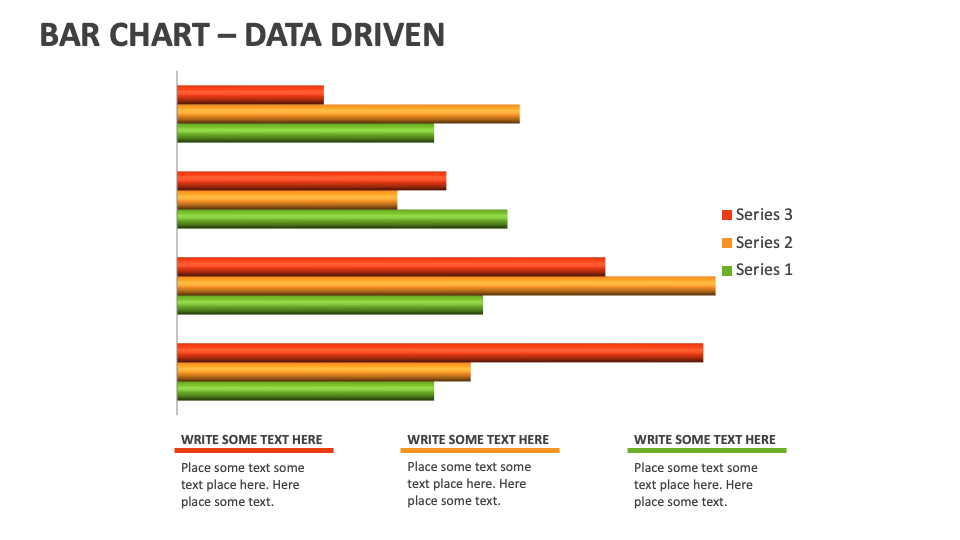
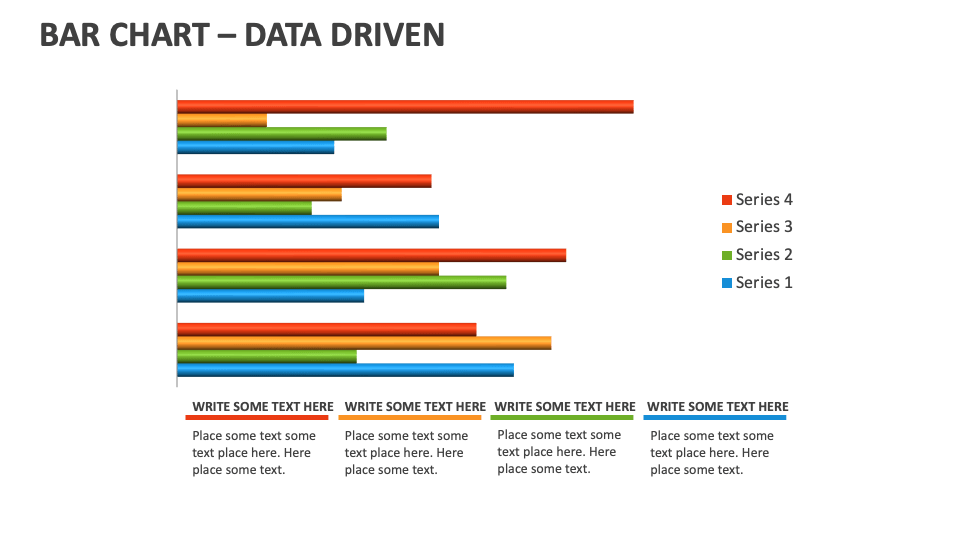
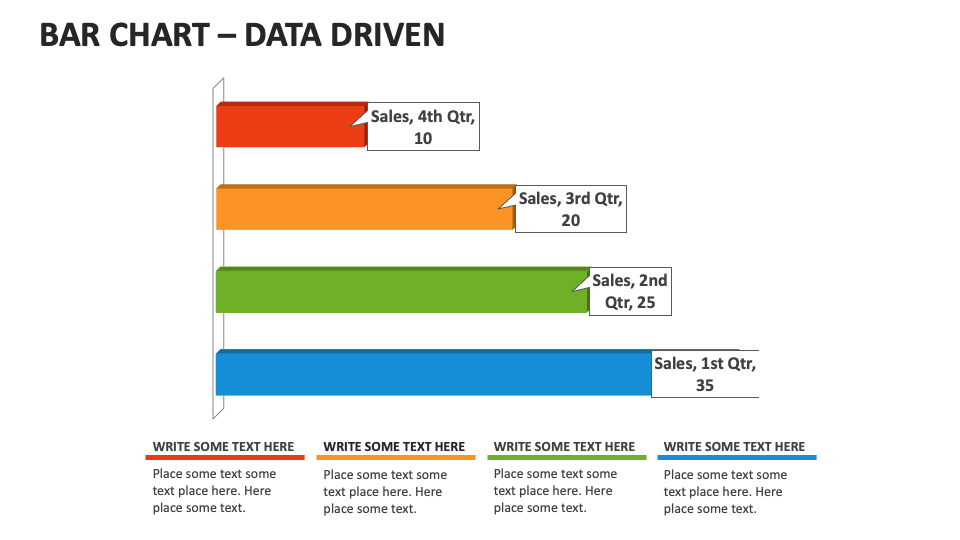
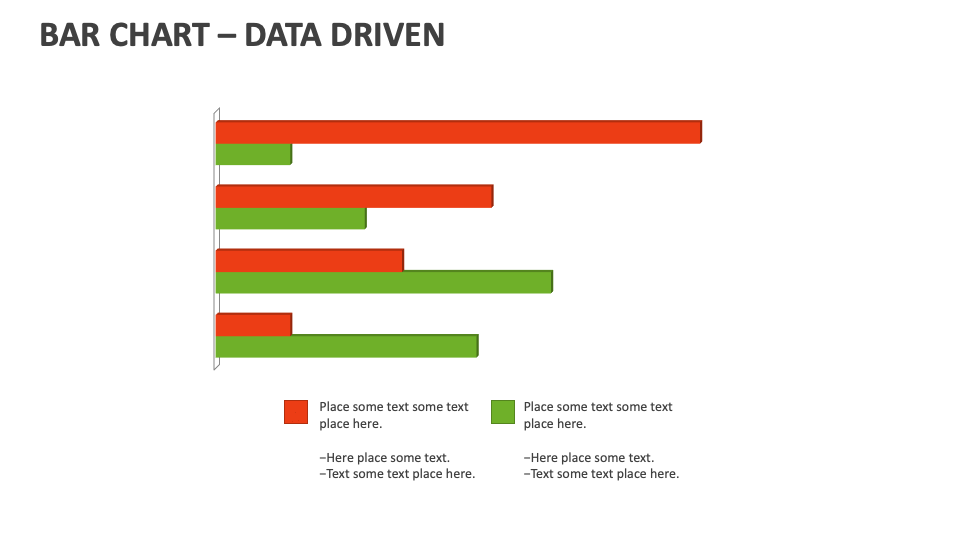
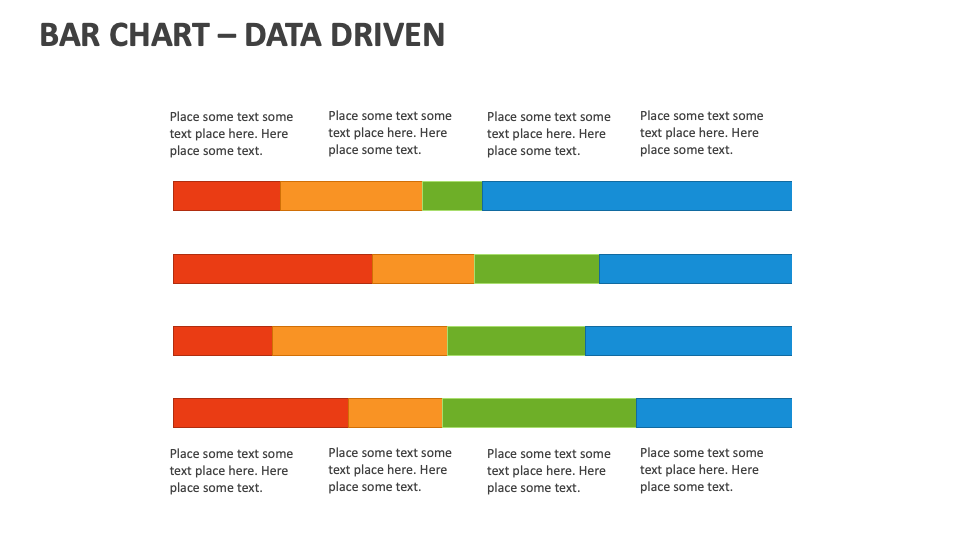
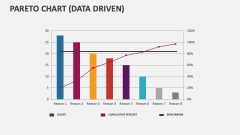
If you wish to present topics or concepts where progress, comparisons, or trends need to be highlighted, get our Bar Chart-Data Driven presentation template for MS PowerPoint and Google Slides without delay! Using these charts, you can present the sales data for different products or product categories, market trends over specific time periods, etc.
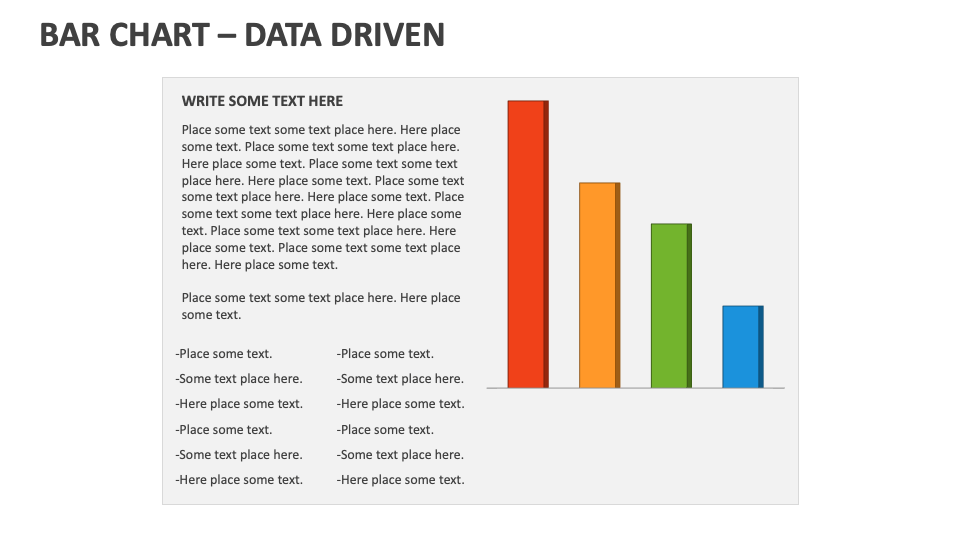
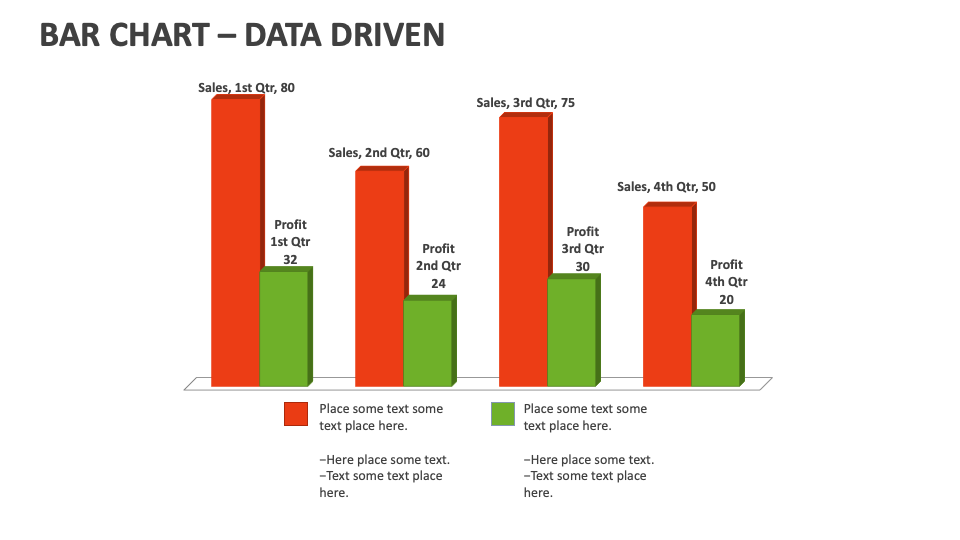
Business leaders and financial heads can visualize the statistics related to monthly/quarterly/yearly revenue from multiple business units or sales activities. Customer success managers and marketing heads can shed light on the growth/decline in customer satisfaction levels, percentage-wise conversion from different social media platforms, and more. IT heads can depict the IT infrastructure's performance based on specific KPIs like server uptime, network latency, etc.