
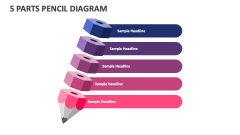
Pencil Bar Chart
In stock
$5.00
item details (2 Editable Slides)
- Applications Supported: PowerPoint, Google Slides
- File Type: .pptx, Google Slides
- Aspect Ratio:16:9 (Wide Screen)
- Animation: Yes
Pencil Bar Chart
Pencil Bar Chart
(2 Editable Slides)
Related Products
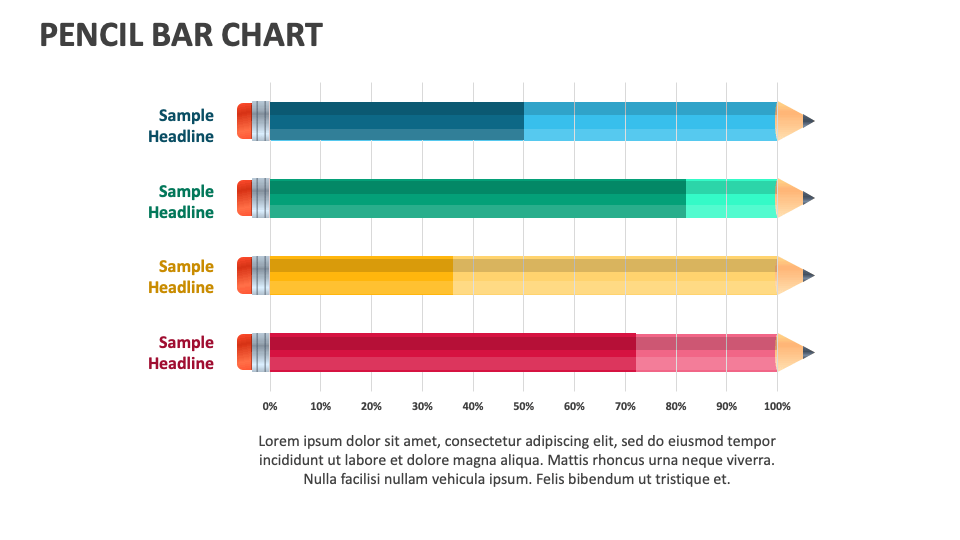
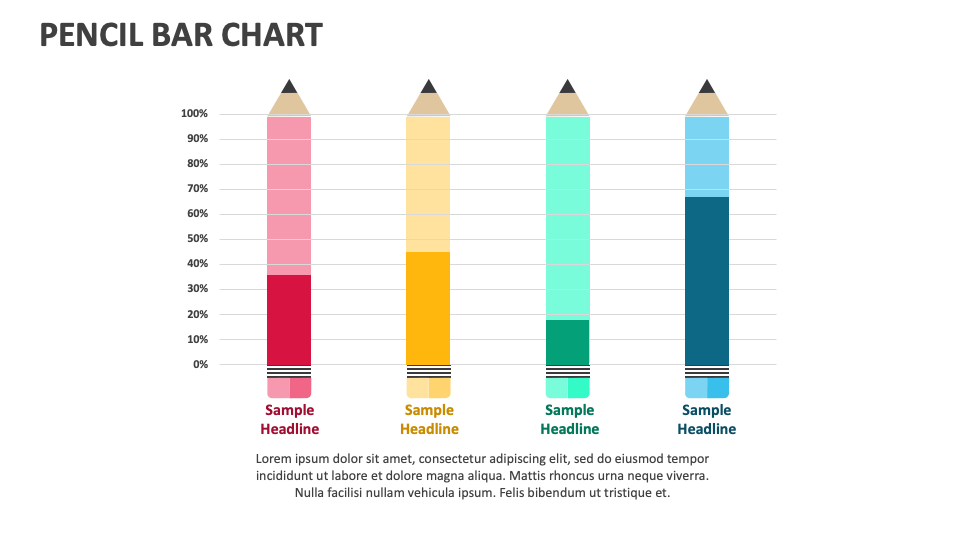
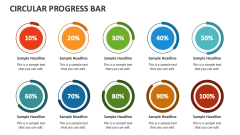
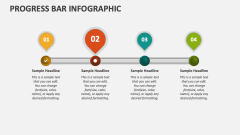
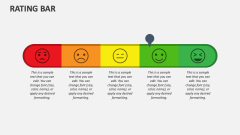
If you wish to represent information, such as sales figures, market analysis, budget allocations, and more, your search is over. Use our Pencil Bar Chart presentation template for MS PowerPoint and Google Slides to display any data where you intend to highlight variations by employing bars of different lengths.
Sales professionals can depict the comparison of their products's market performance, sales growth, market share, etc. Researchers and data scientists can utilize this versatile PPT to communicate data trends, comparisons of research findings, and demographic data. Business leaders can include these illustrations in their presentations to depict their company’s growth over the years, revenue variations, and other statistical information.