
Pie Chart Icons
In stock
$5.00
item details (1 Editable Slide)
- Applications Supported: PowerPoint, Google Slides
- File Type: .pptx, Google Slides
- Aspect Ratio:16:9 (Wide Screen)
- Animation: No
Pie Chart Icons
Pie Chart Icons
(1 Editable Slide)
Related Products

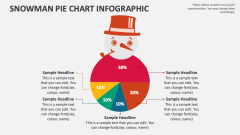
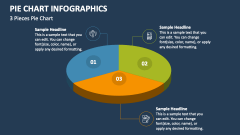
Lay your hands on our Pie Chart Icons for MS PowerPoint and Google Slides to add meaning to statistical or numerical-based information in an easy-to-understand manner. The PPT features icons of pie charts in various color tones.
Marketing heads and sales managers can make the best use of this icon set to support text about the percentage of leads converted through the implementation of marketing campaigns, the percentage contribution of each branch/location to the overall sales figures, etc. Business owners can visualize the breakdown of their overall revenue, the budget allocated for different departments in the company, and more. Market analysts can highlight content about market trends, a company’s market share, changing demographics, and more.