
Snowman Pie Chart Infographic
In stock
$5.00
item details (10 Editable Slides)
- Applications Supported: PowerPoint, Google Slides
- File Type: .pptx, Google Slides
- Aspect Ratio:16:9 (Wide Screen)
- Animation: Yes
Snowman Pie Chart Infographic
Snowman Pie Chart Infographic
(10 Editable Slides)
Related Products


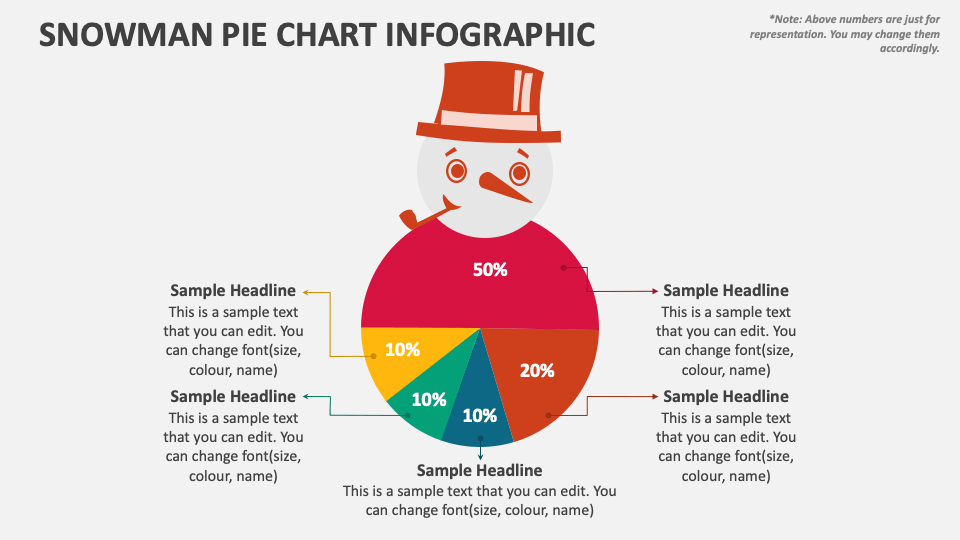
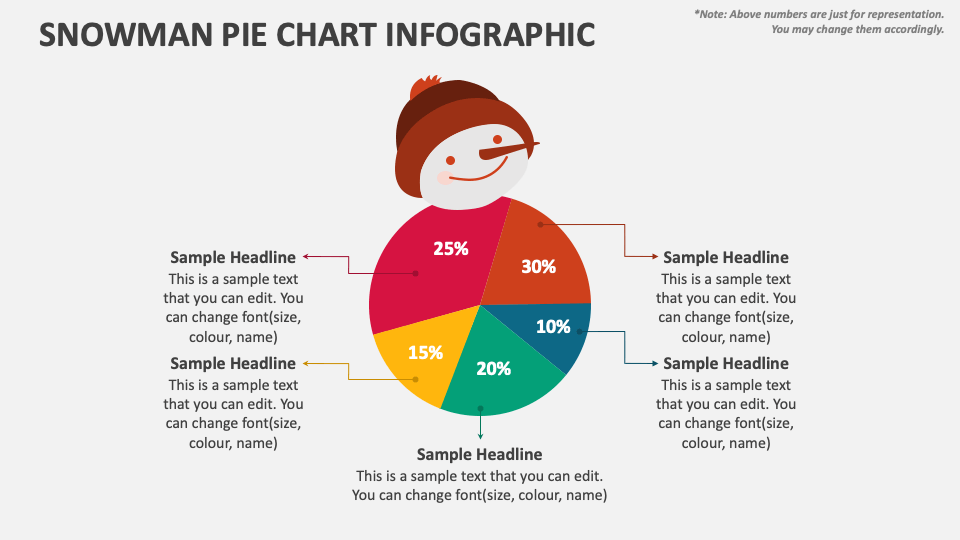
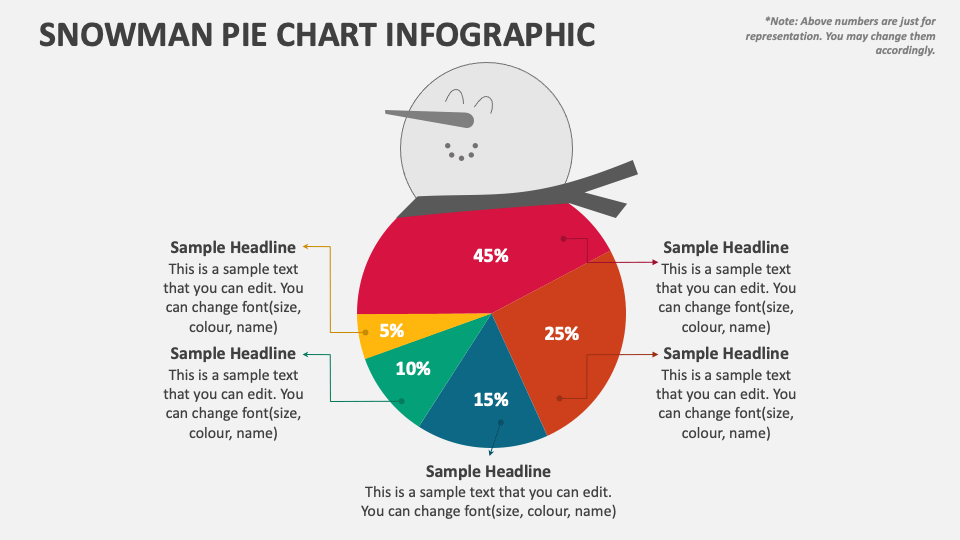
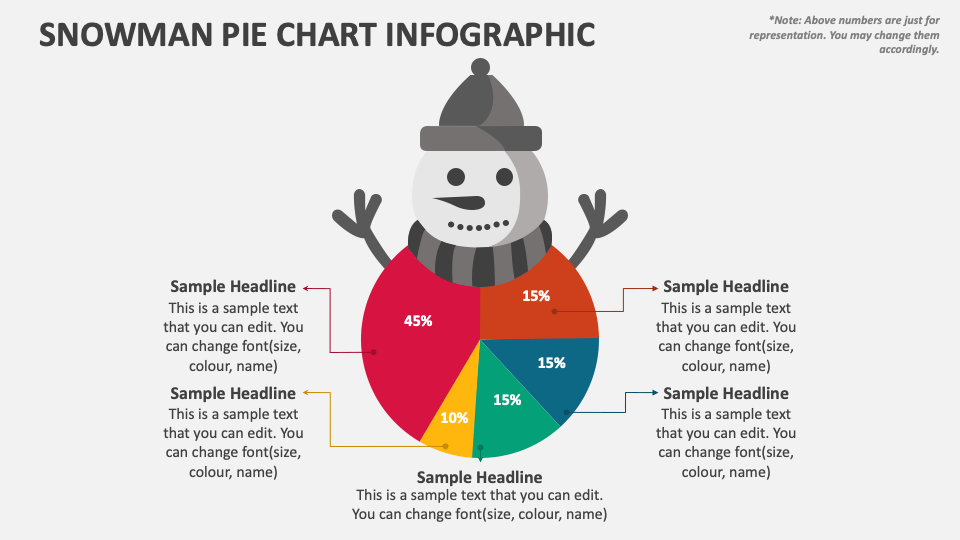
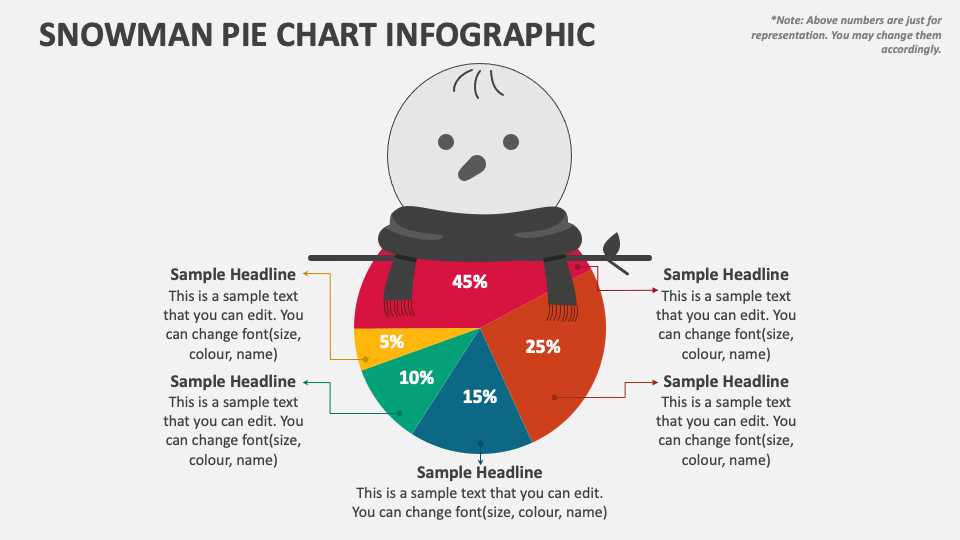
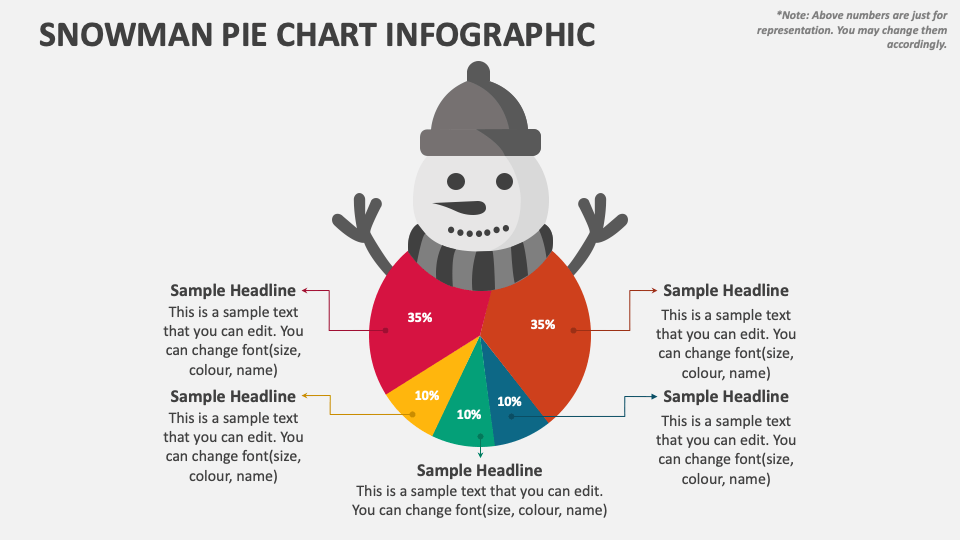
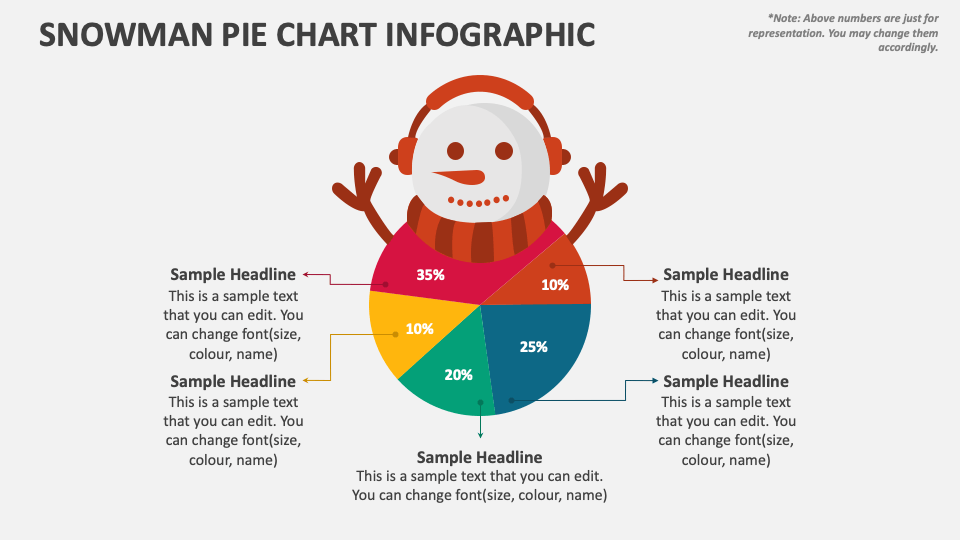
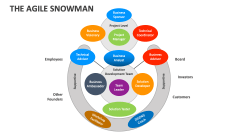
If you wish to present complex statistical information in a unique and engaging manner, then our Snowman Pie Chart presentation template for MS PowerPoint and Google Slides is perfect for you. Download it now and depict topics like budget breakdown, performance of different business units, survey results, and other related topics.
Business leaders can demonstrate the percentages of the company’s market share, resource distribution among different departments/projects, etc. Sales managers can use this set to highlight the revenue/profits generated by their products and services from different geographic regions and branches. Financial advisors can visualize the composition of a client's investment portfolio across different asset classes, allocation of retirement funds among different investment options, and more.