
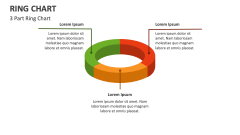
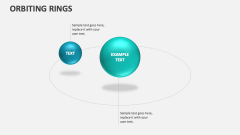
Ring Diagram
In stock
$5.00
item details (8 Editable Slides)
- Applications Supported: PowerPoint, Google Slides
- File Type: .pptx, Google Slides
- Aspect Ratio:16:9 (Wide Screen)
- Animation: Yes
Ring Diagram
Ring Diagram
(8 Editable Slides)
Related Products

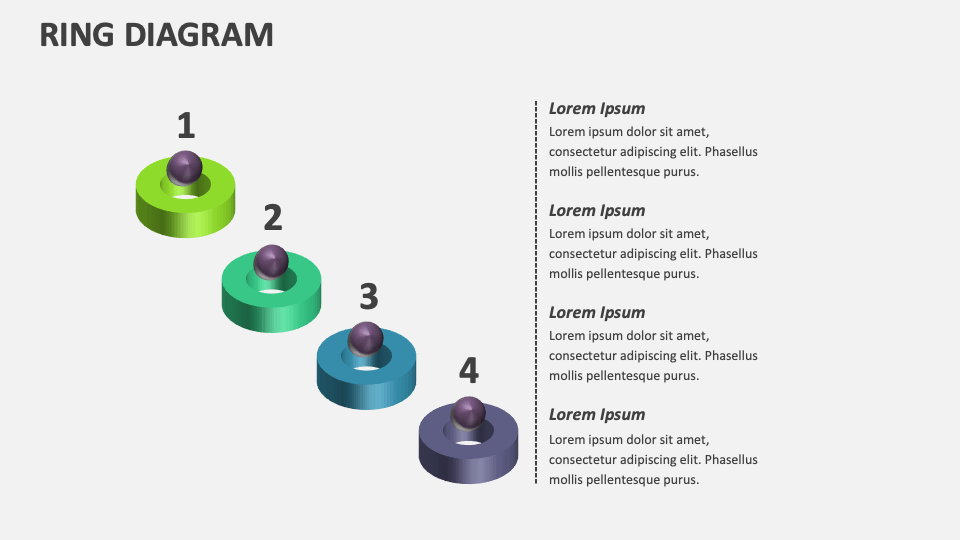
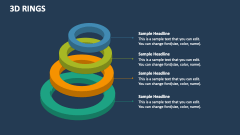
Use our multipurpose Ring Diagram for MS PowerPoint and Google Slides to showcase budget allocation among various organizational departments, the percentage of market share held by different companies in an industry, multiple layers of cybersecurity, the hierarchical level of an organization, and more.
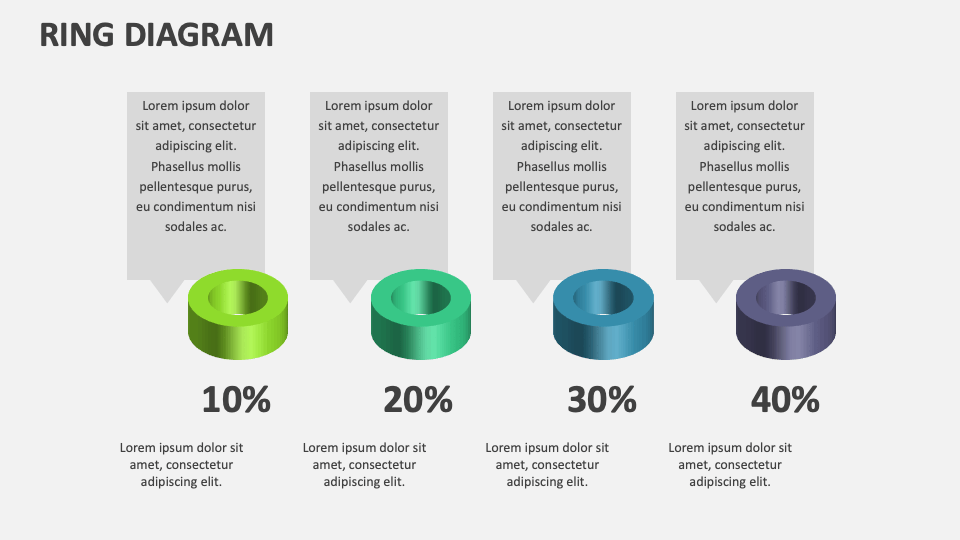
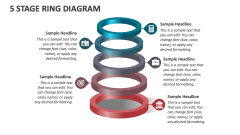
Project heads can use this deck to highlight the completion status of various project phases or milestones. Marketing professionals can illustrate the percentage contribution of multiple marketing channels to overall sales figures. IT heads and technology experts can explain how different elements of IT infrastructure are interconnected to support overall system functionality. Business leaders can showcase the importance of team cohesion and collaboration in accomplishing a common goal.