
Line & Trends Chart (Data Driven)
In stock
$5.00
item details (3 Editable Slides)
- Applications Supported: PowerPoint, Google Slides
- File Type: .pptx, Google Slides
- Aspect Ratio:16:9 (Wide Screen)
- Animation: Yes
Line & Trends Chart (Data Driven)
Line & Trends Chart (Data Driven)
(3 Editable Slides)
Related Products
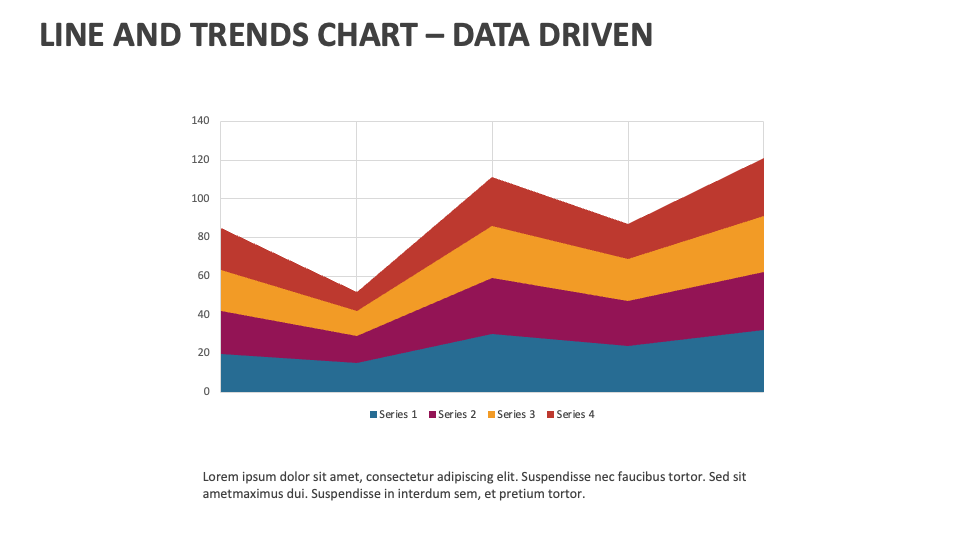
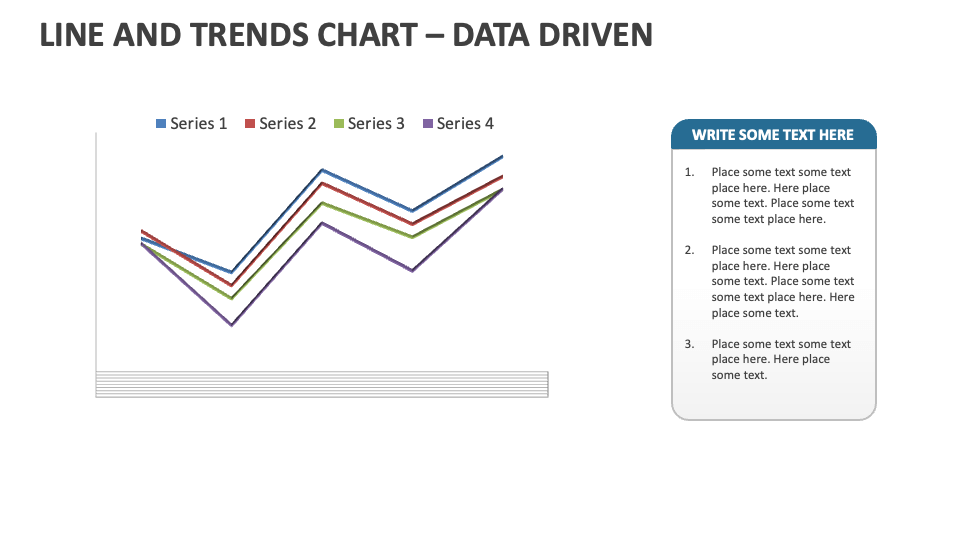
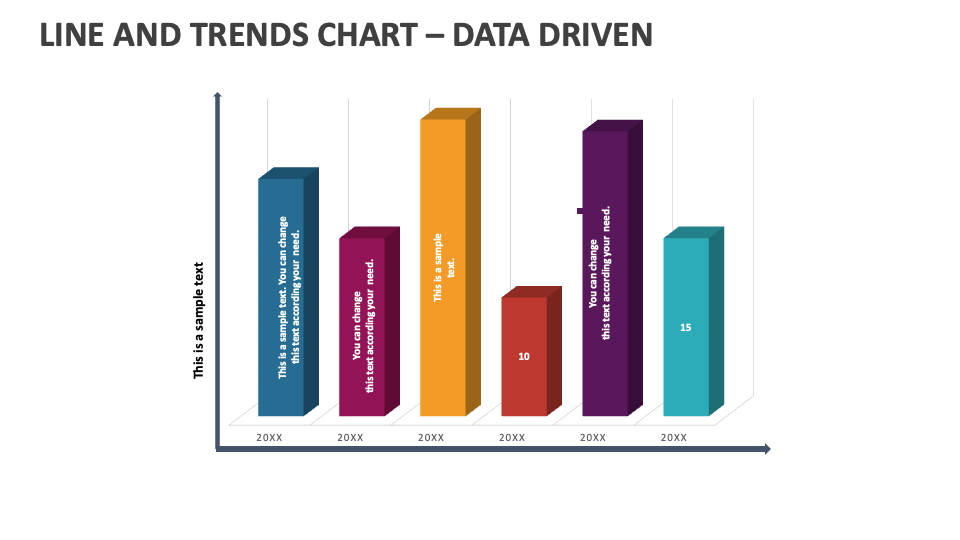
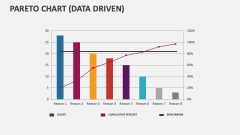
Grab our Line and Trends Chart-Data Driven MS PowerPoint and Google Slides to showcase data points over time, indicating trends and patterns. Use this multipurpose template to present product usage or popularity trends, future values of stocks/investments, etc., in a visually stimulating manner.
Business heads and financial experts can use the deck to show their firm's stock value performance in the stock market over a specific period. Sales heads and market analysts can visualize trends in sales performance and shifts in market demand or consumer behavior over time. Economists and educators can shed light on trends in economic data such as GDP, inflation, or unemployment rates. SEO experts can highlight changes in website visits, bounce rates, and user engagement.