
Bradley Curve
In stock
$5.00
item details (8 Editable Slides)
- Applications Supported: PowerPoint, Google Slides
- File Type: .pptx, Google Slides
- Aspect Ratio:16:9 (Wide Screen)
- Animation: Yes
Bradley Curve
Bradley Curve
(8 Editable Slides)

Related Products

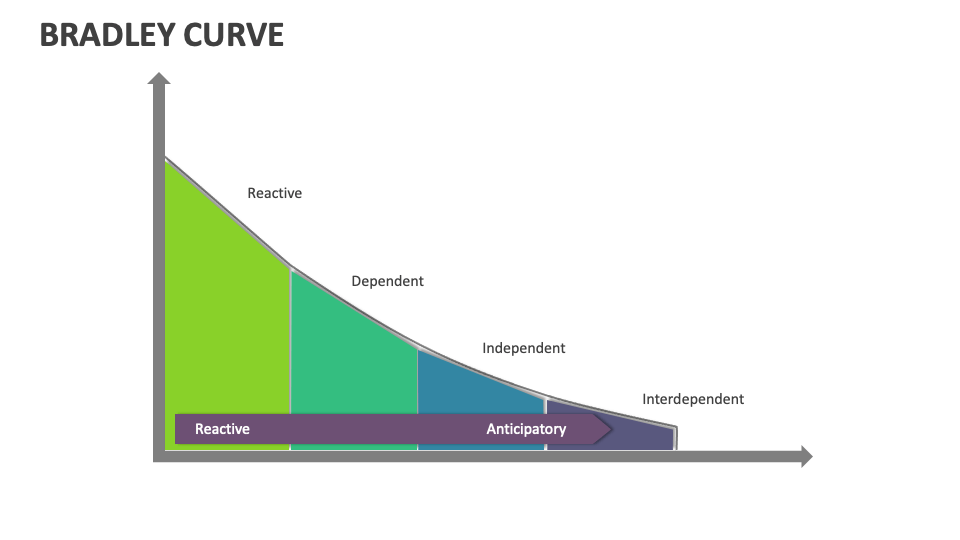
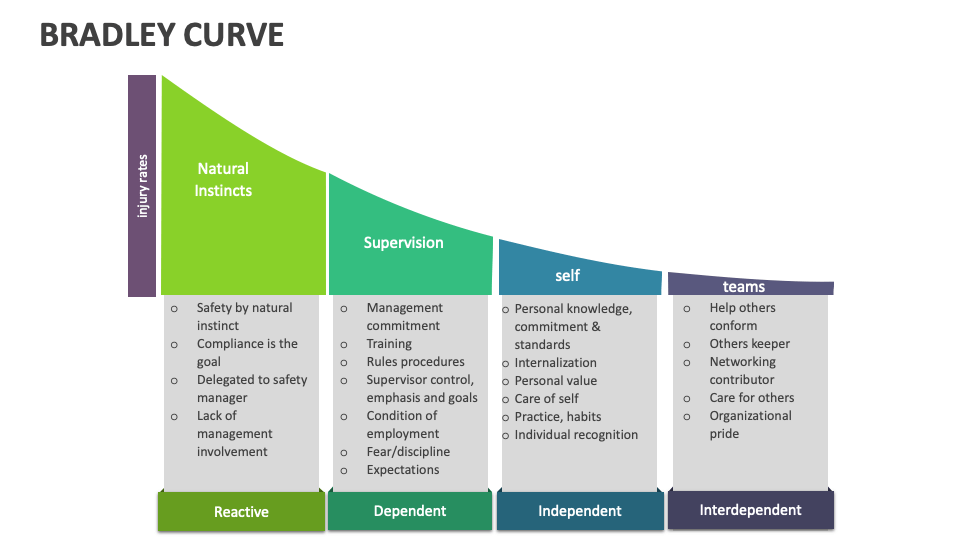
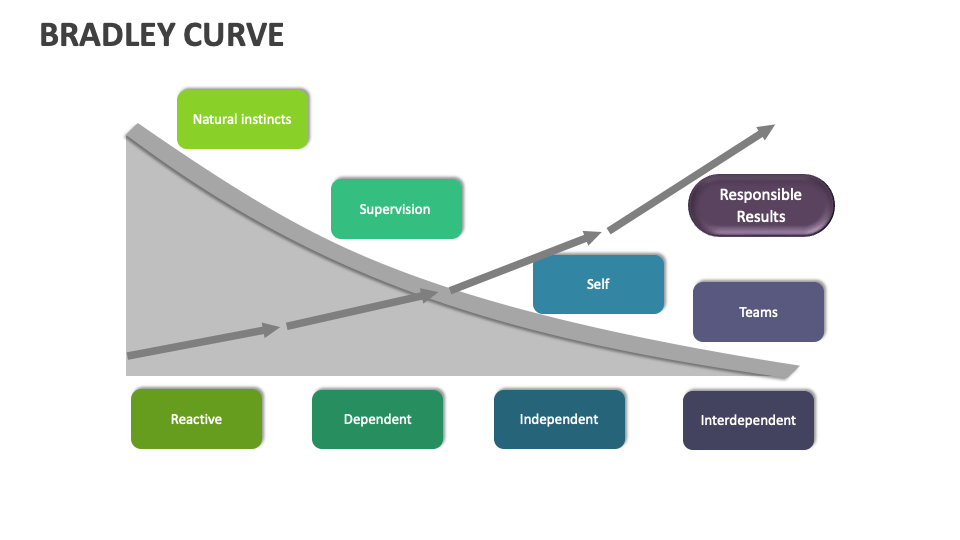
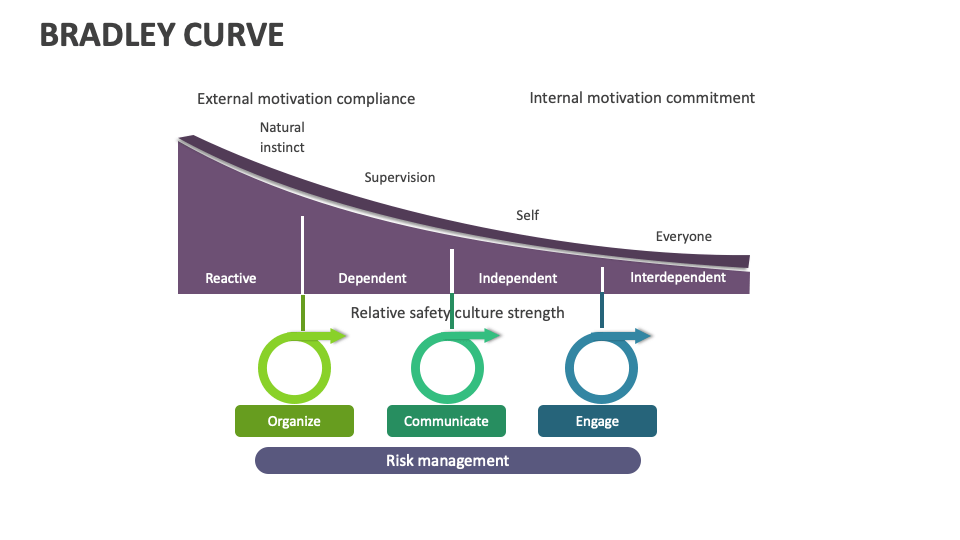
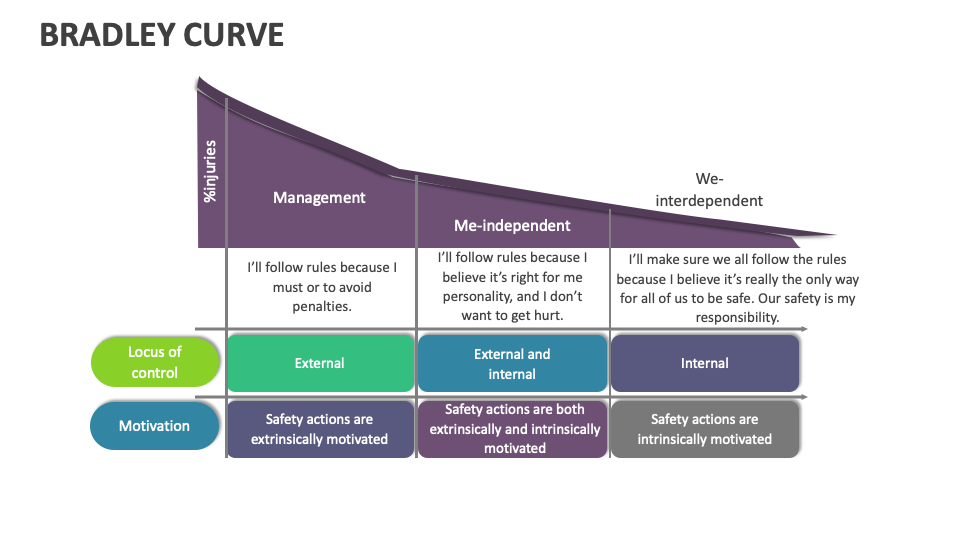
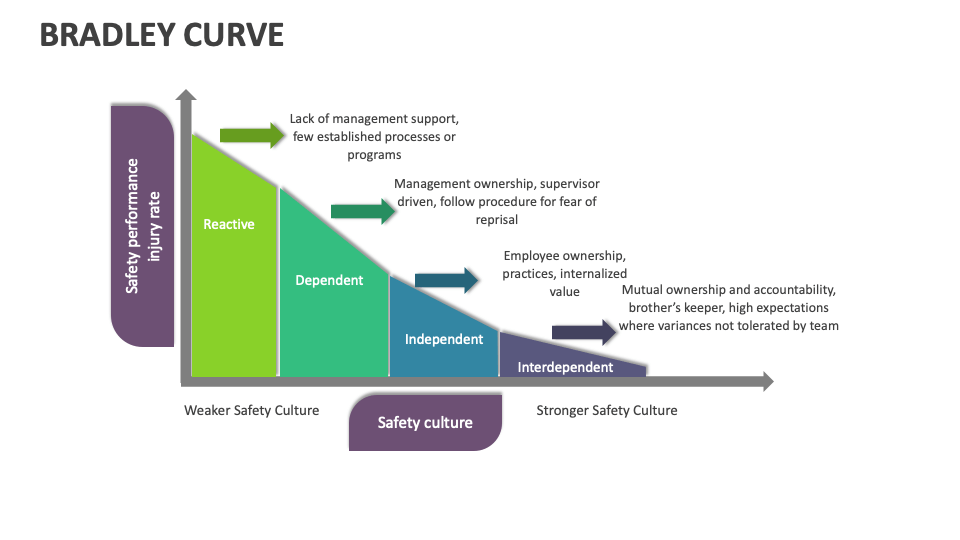
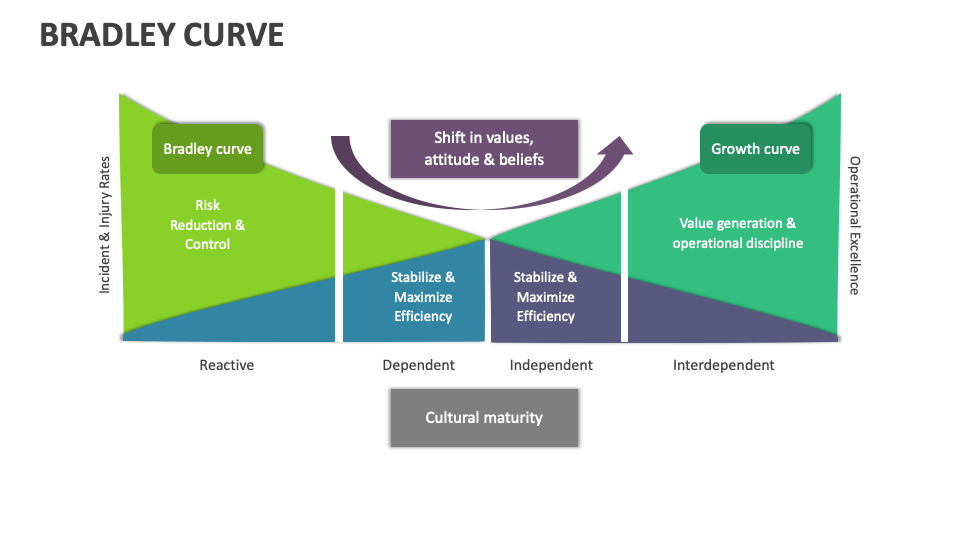
Lay your hands on our Bradley Curve MS PowerPoint and Google Slides presentation template to showcase the model that illustrates the correlation between operational performance and safety culture in an organization. 100% customizable slides!
Safety experts and business leaders can utilize this deck to highlight the stages of safety culture maturity in an organization. You can illustrate the strategies that help enterprises assess their safety culture and progress toward higher levels of maturity. You can also demonstrate how this curve can be used to outline the features of weaker and stronger safety cultures. You can further explain how, by understanding where they stand on the curve, companies can implement targeted interventions to improve safety practices and ultimately achieve a safer work environment.