
Butterfly Chart
In stock
$5.00
item details (4 Editable Slides)
- Applications Supported: PowerPoint, Google Slides
- File Type: .pptx, Google Slides
- Aspect Ratio:16:9 (Wide Screen)
- Animation: Yes
Butterfly Chart
Butterfly Chart
(4 Editable Slides)
Related Products

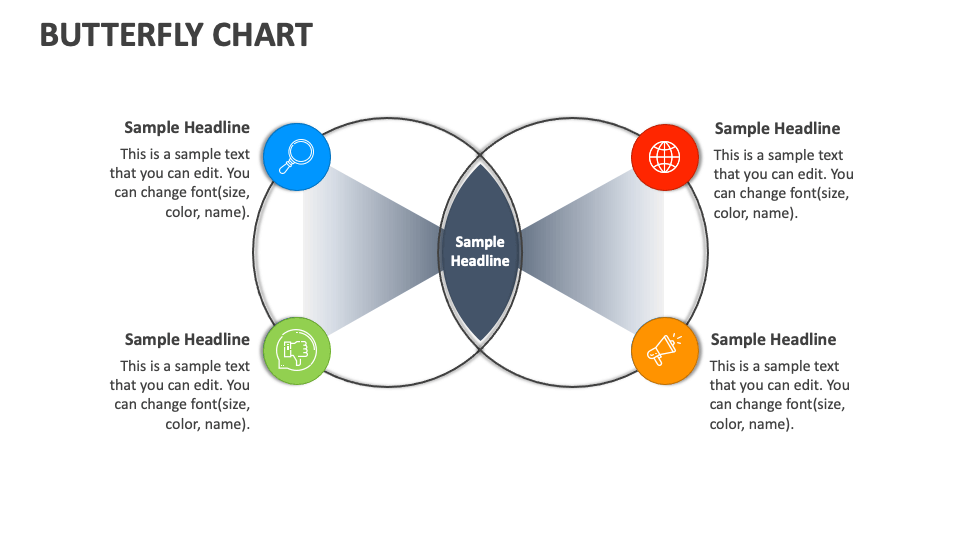
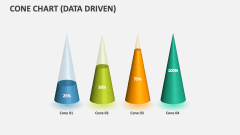
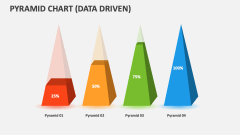
If you wish to represent comparative analysis between two data sets in a visually appealing manner, then our Butterfly Chart presentation template for MS PowerPoint and Google Slides is perfect for you. Download it now to depict project decisions, the cause and effect of a problem, and more.
Business leaders and senior executives can use these slides to depict topics like SWOT analysis, possible alternatives of emerging business ideas, potential outcomes of implementing a new strategy, etc. Educators can explain different methods to approach/solve a problem to their students. Product managers and markets can showcase the unique features of their products and how they differ from the competitors'.