
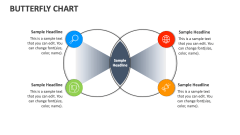
Butterfly Effect Diagram
In stock
$5.00
item details (7 Editable Slides)
- Applications Supported: PowerPoint, Google Slides
- File Type: .pptx, Google Slides
- Aspect Ratio:16:9 (Wide Screen)
- Animation: Yes
Butterfly Effect Diagram
Butterfly Effect Diagram
(7 Editable Slides)


Related Products


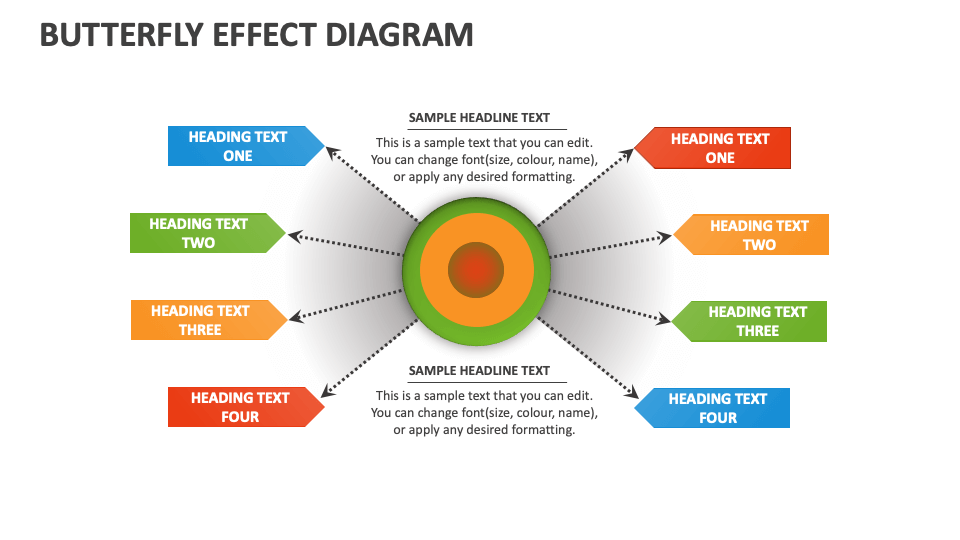
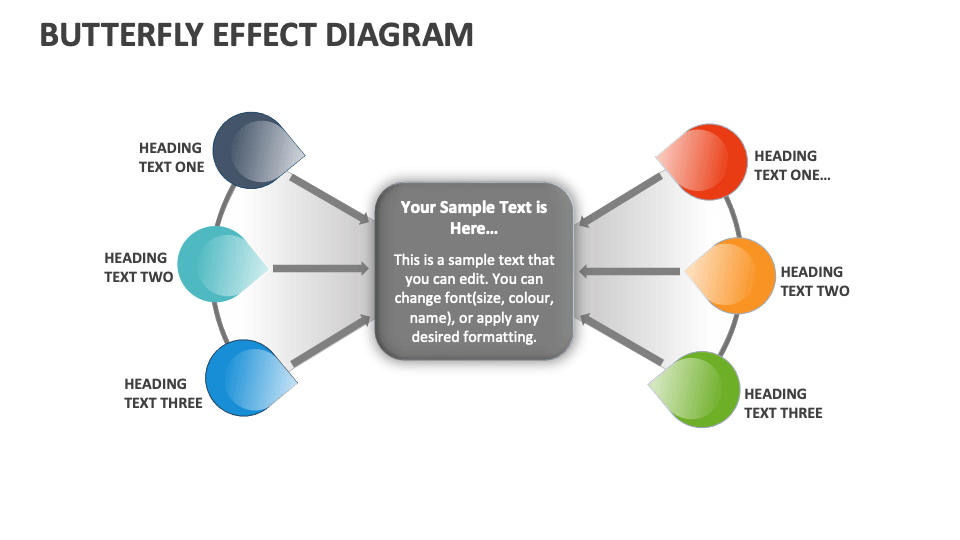
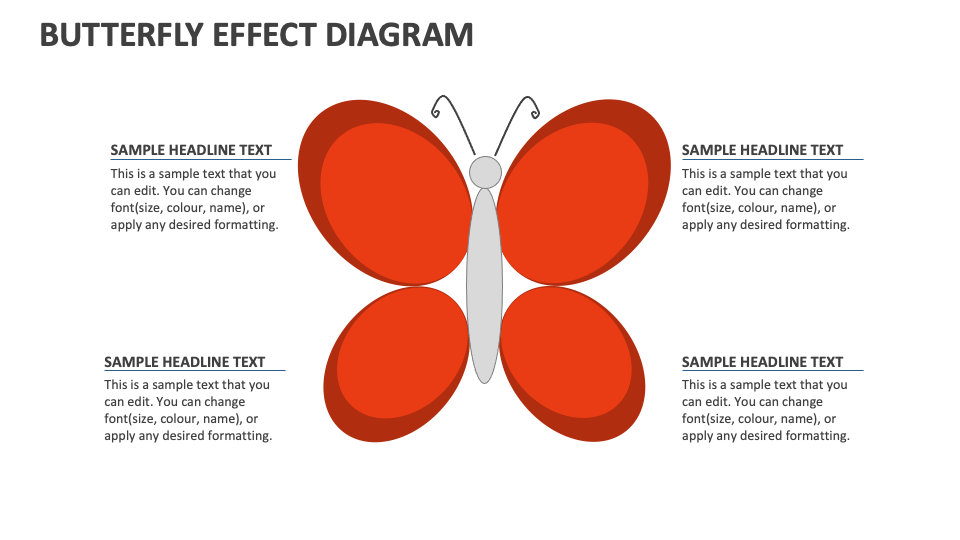
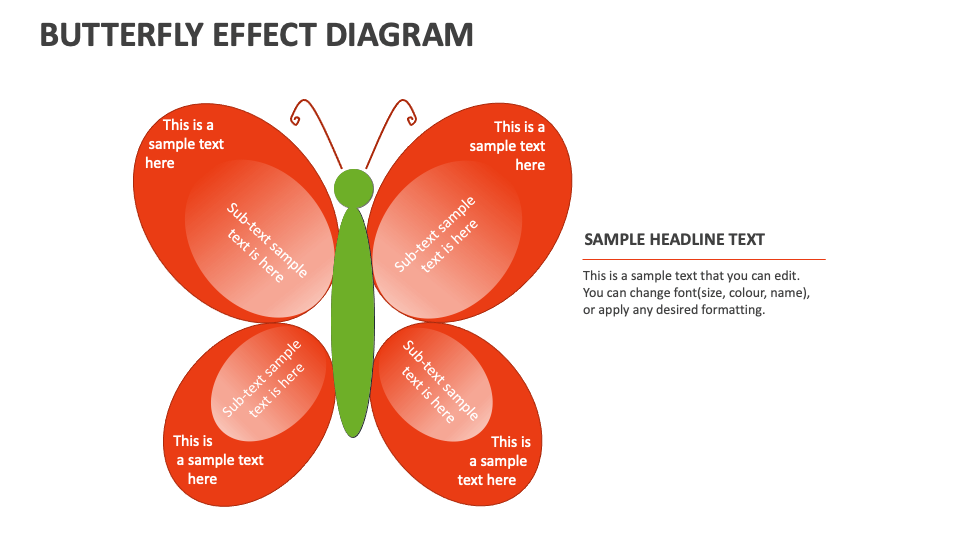
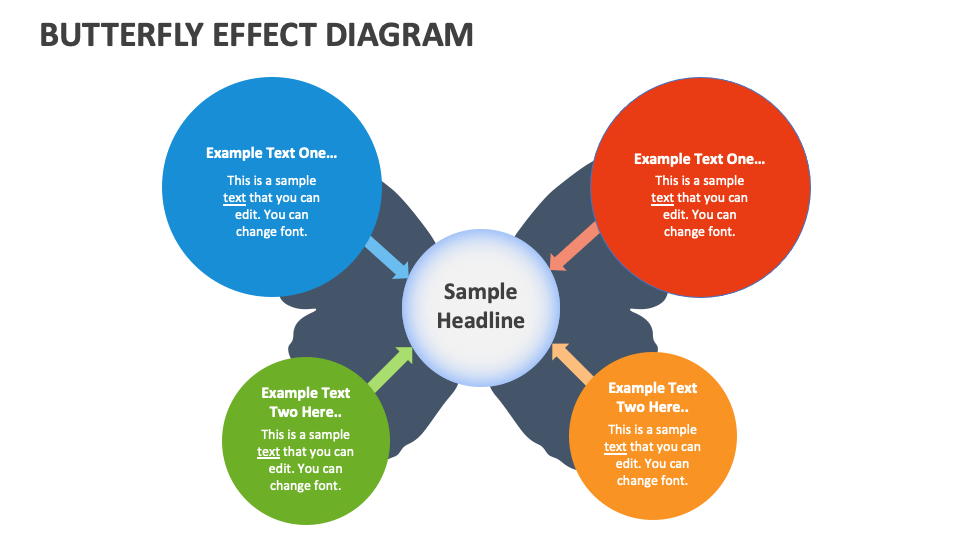
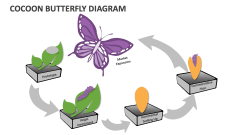
If you wish to depict topics or concepts about contrasts within data sets or how small actions or changes can lead to significant, often unpredictable, consequences, download our Butterfly Effect Diagram for MS PowerPoint and Google Slides without a second thought! All the slides are 100% customizable.
Market analysts can utilize this customizable template to illustrate market trends' positive and negative aspects. Sales and marketing heads can shed light on the strengths and weaknesses of different products. IT heads can explain how minor IT system or software configuration changes can lead to significant operational impacts. HR heads can visualize the considerable improvements in morale and productivity after implementing small changes in employee engagement strategies.