
Louisiana Map
In stock
$5.00
item details (5 Editable Slides)
- Applications Supported: PowerPoint, Google Slides
- File Type: .pptx, Google Slides
- Aspect Ratio:16:9 (Wide Screen)
- Animation: No
Louisiana Map
Louisiana Map
(5 Editable Slides)
Related Products

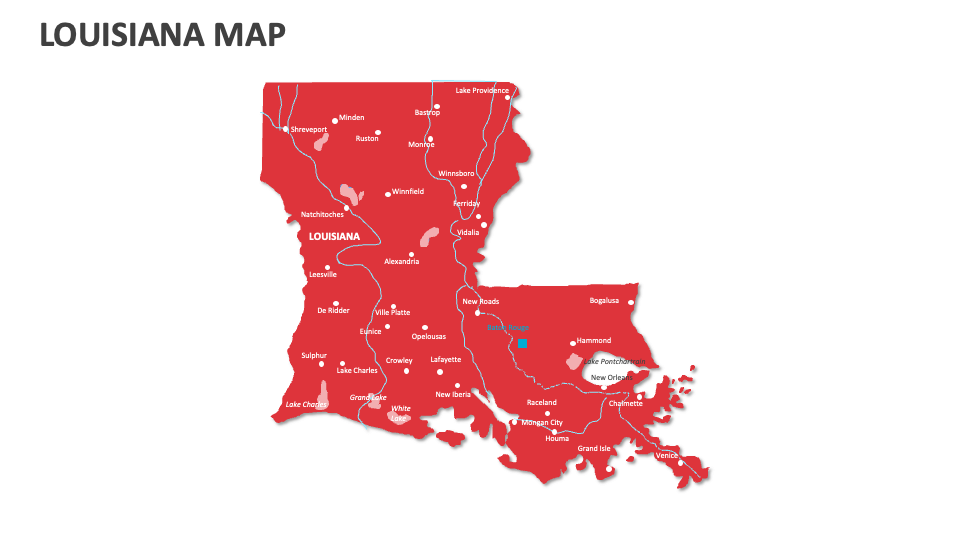
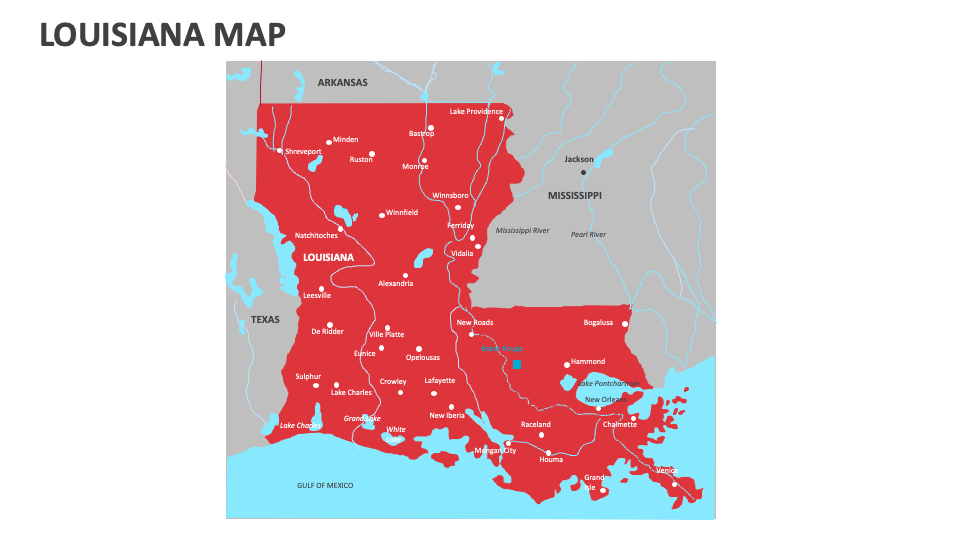
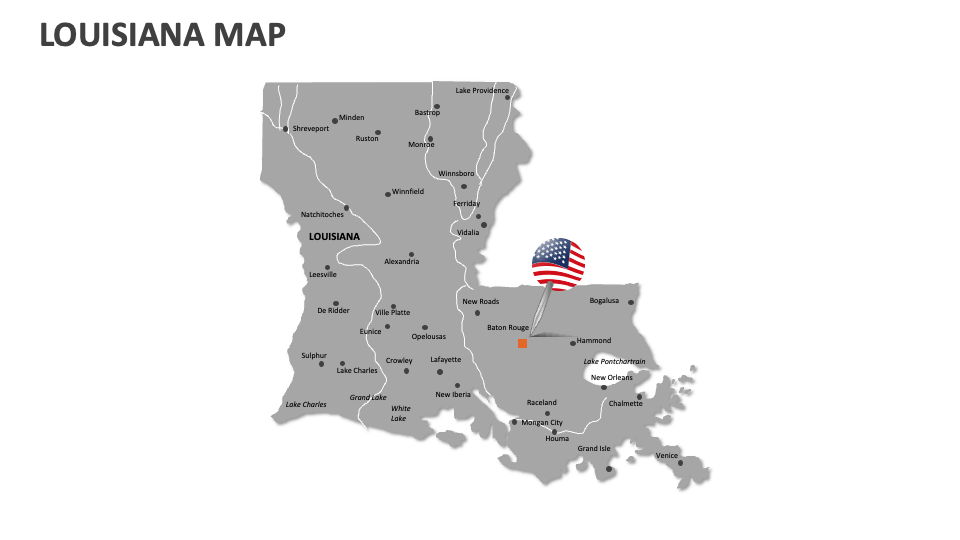
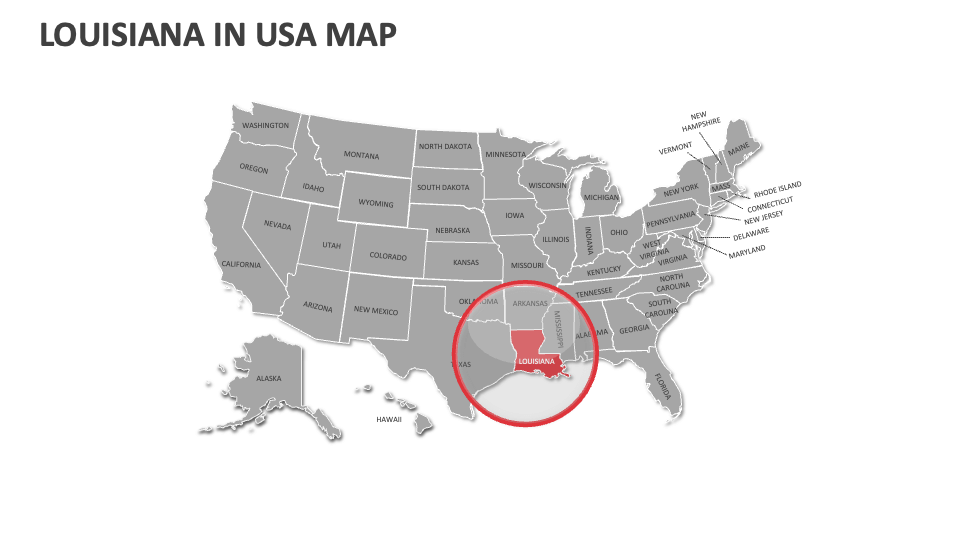
Lay your hands on Louisiana Map MS PowerPoint and Google Slides presentation template to depict the political boundaries, agricultural areas and crop distributions, disaster management zones, and demographic data across different regions in Louisiana.
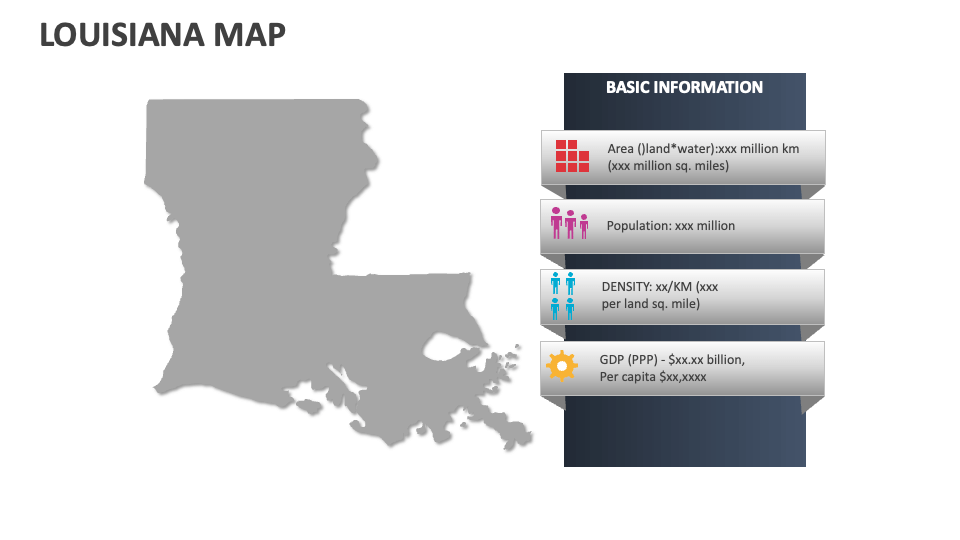
Business leaders can highlight the locations of their corporate offices, headquarters, sales territories, and customer support branches across Louisiana. Telecommunication experts can shed light on smart city projects and their geographic implementation across various cities in this U.S. state. Educators can visualize information about Louisiana’s population density, GDP, literacy rate, exact location in America, etc.