
Mekko Chart
In stock
$5.00
item details (2 Editable Slides)
- Applications Supported: PowerPoint, Google Slides
- File Type: .pptx, Google Slides
- Aspect Ratio:16:9 (Wide Screen)
- Animation: Yes
Mekko Chart
Mekko Chart
(2 Editable Slides)
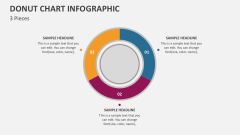
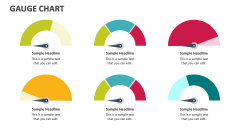
Related Products

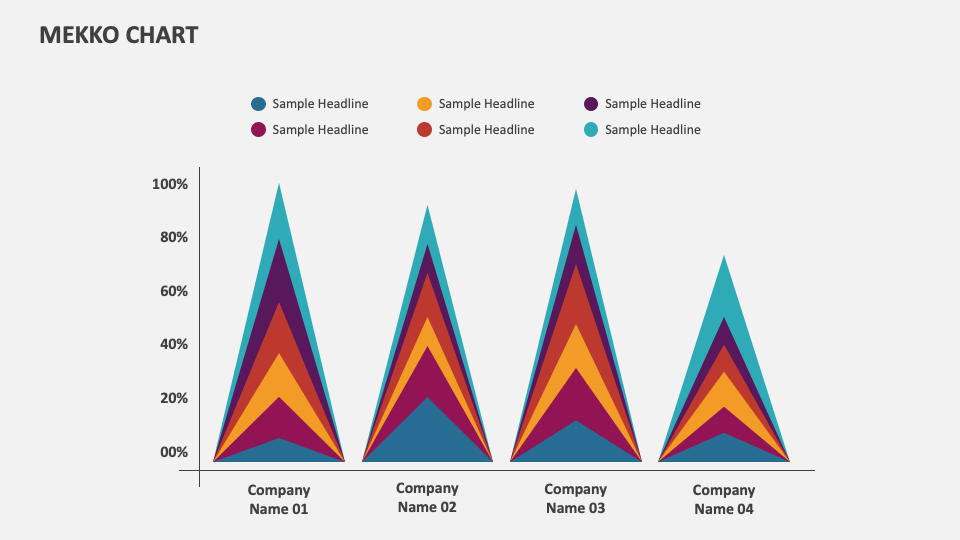
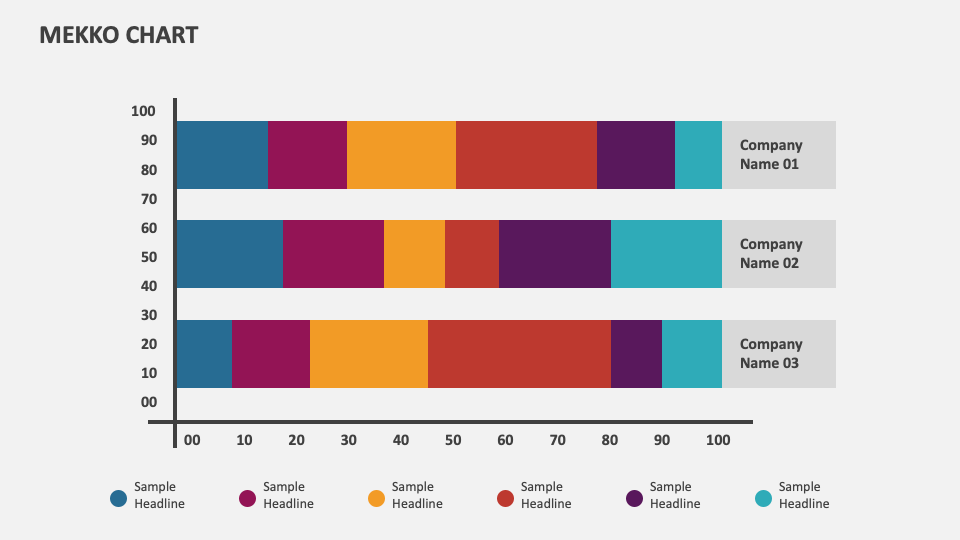
We have introduced the Mekko Chart presentation template for MS PowerPoint and Google Slides to help you visualize categorical sample data or the relationships between certain variables in a two-dimensional form.
Sales and marketing professionals can utilize this deck to showcase the sales performance and revenue breakdown of products based on region, target customer groups, etc. Market analysts can represent market segmentation and the growth rates of certain products within different geographical areas. Project managers can demonstrate information related to resource allocation, project timelines, budget distribution, and more.