




Spiral Chart
In stock
$5.00
item details (10 Editable Slides)
- Applications Supported: PowerPoint, Google Slides
- File Type: .pptx, Google Slides
- Aspect Ratio:16:9 (Wide Screen)
- Animation: Yes
Spiral Chart
Spiral Chart
(10 Editable Slides)
Related Products

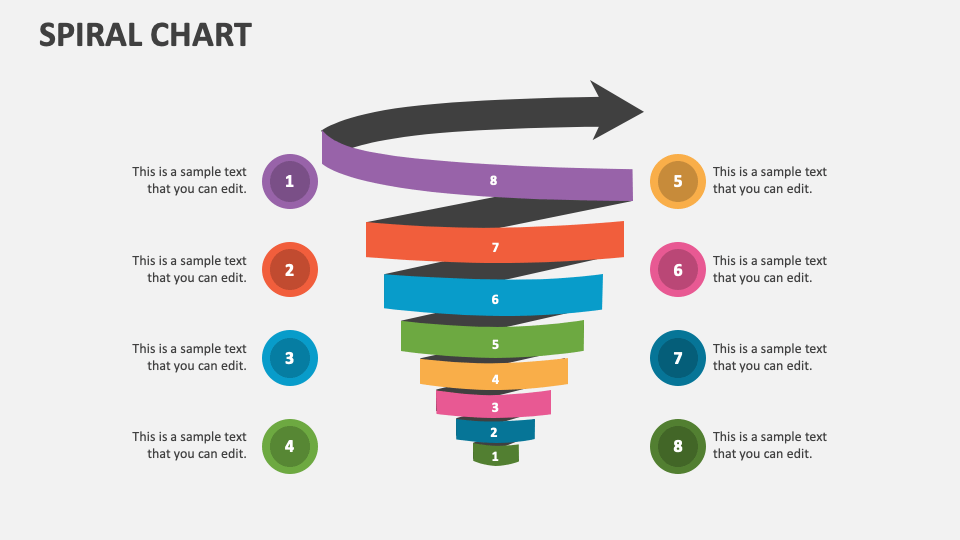
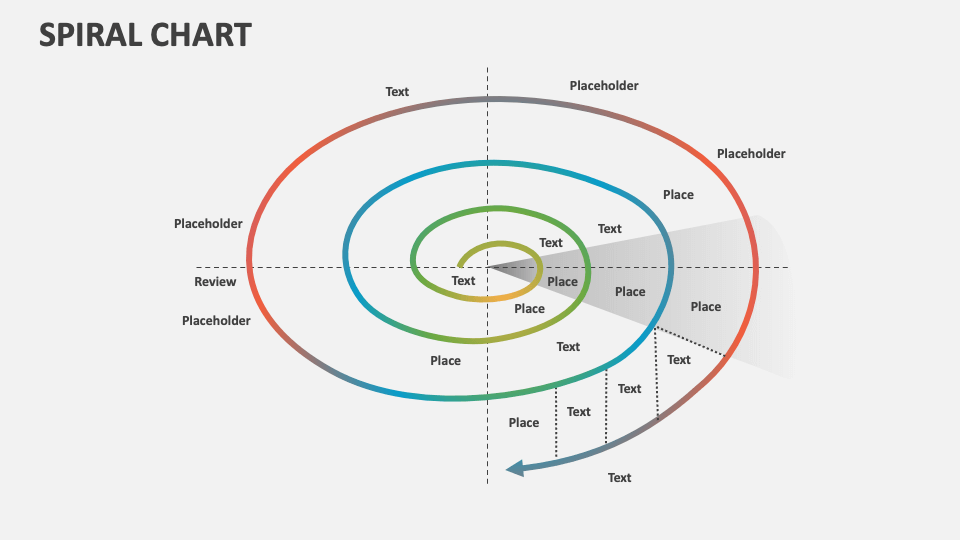
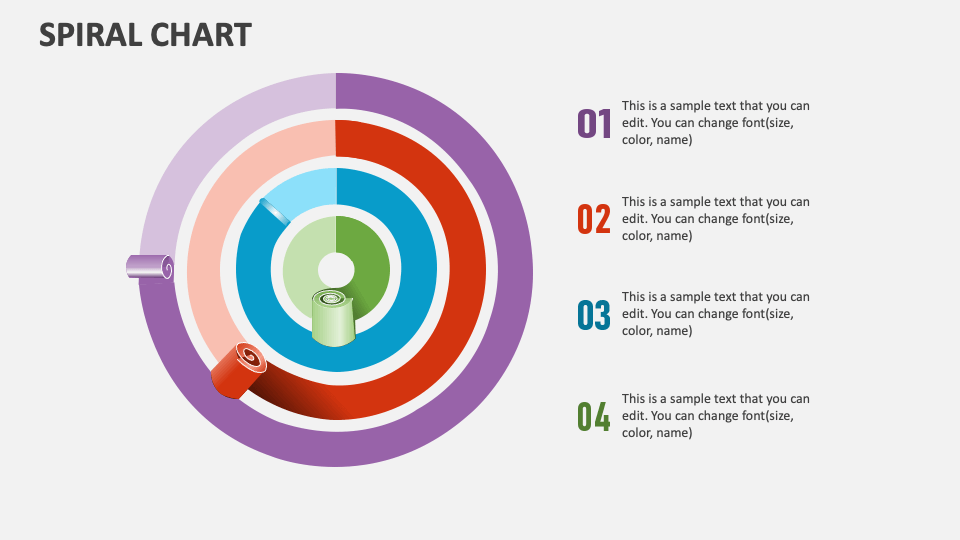
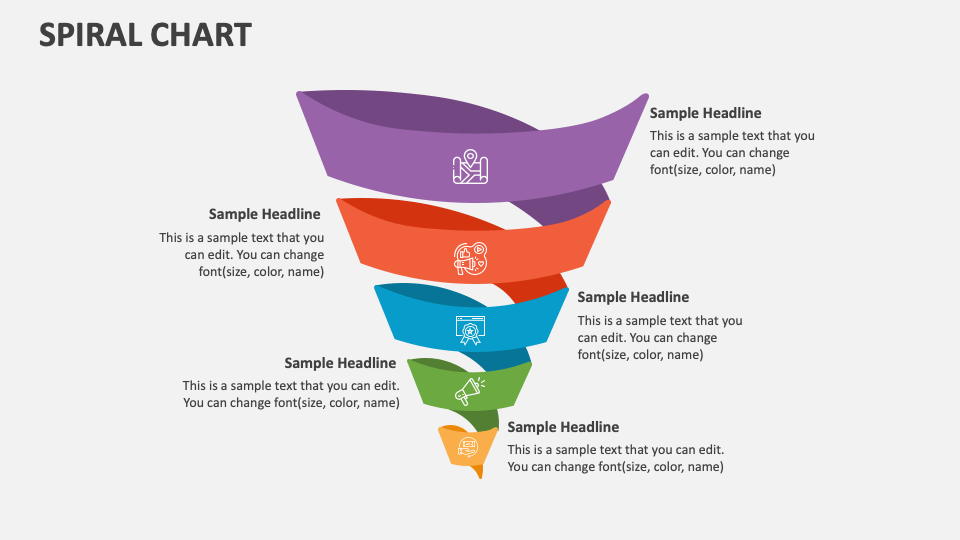
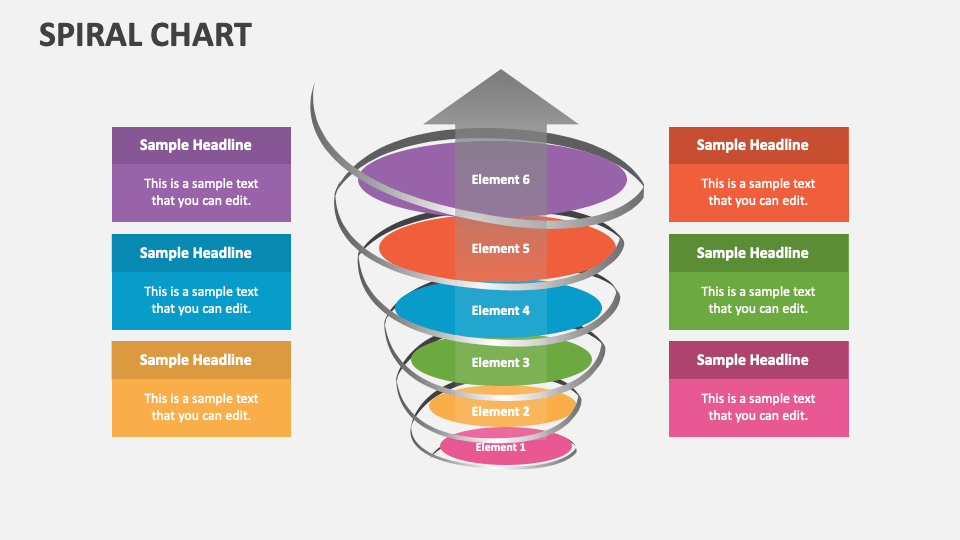
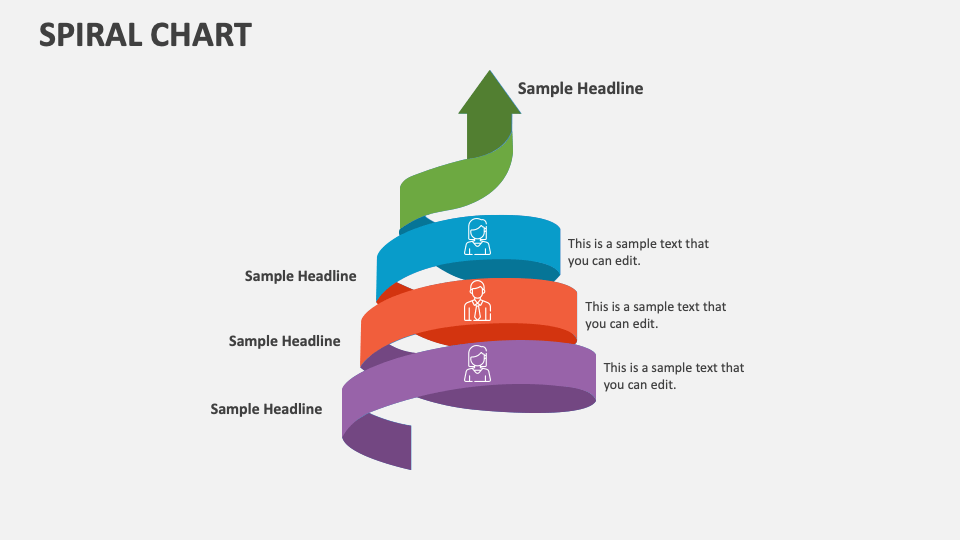
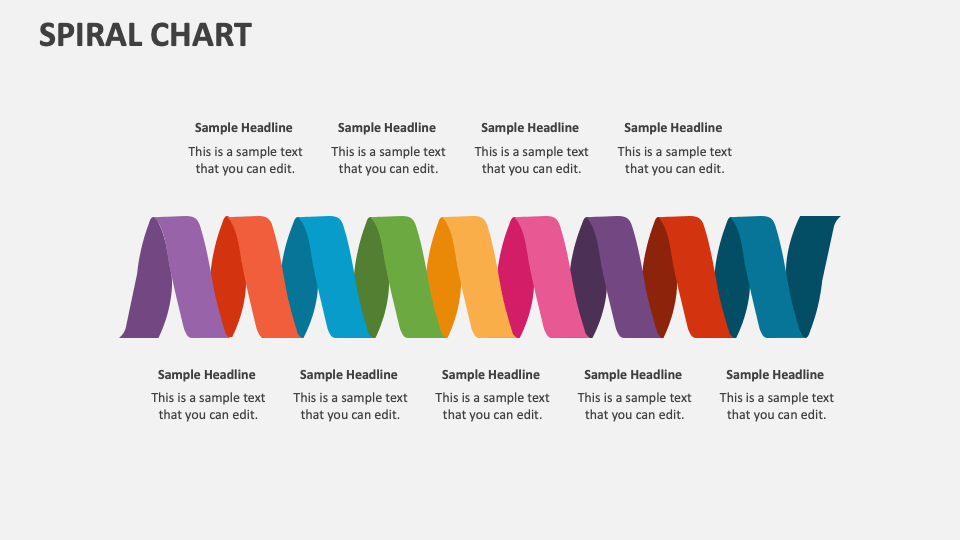
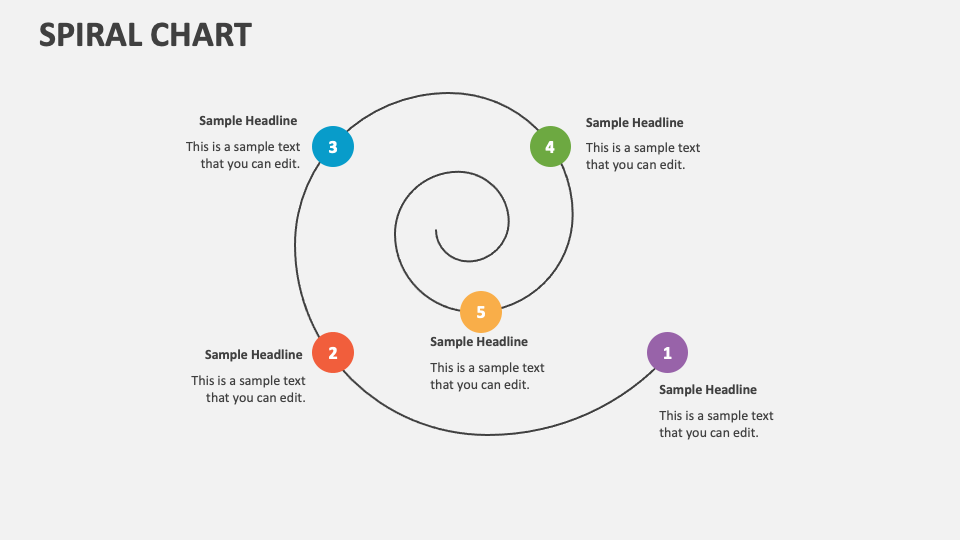
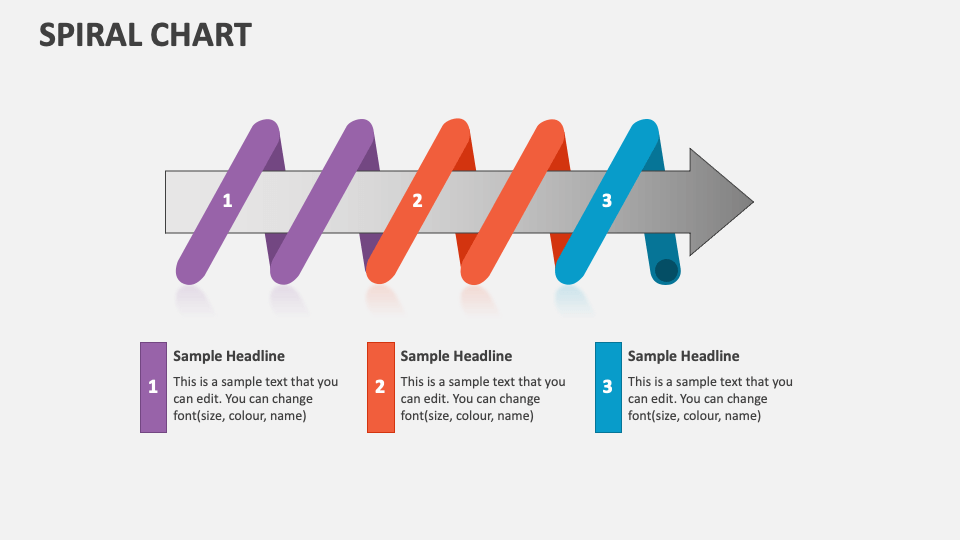
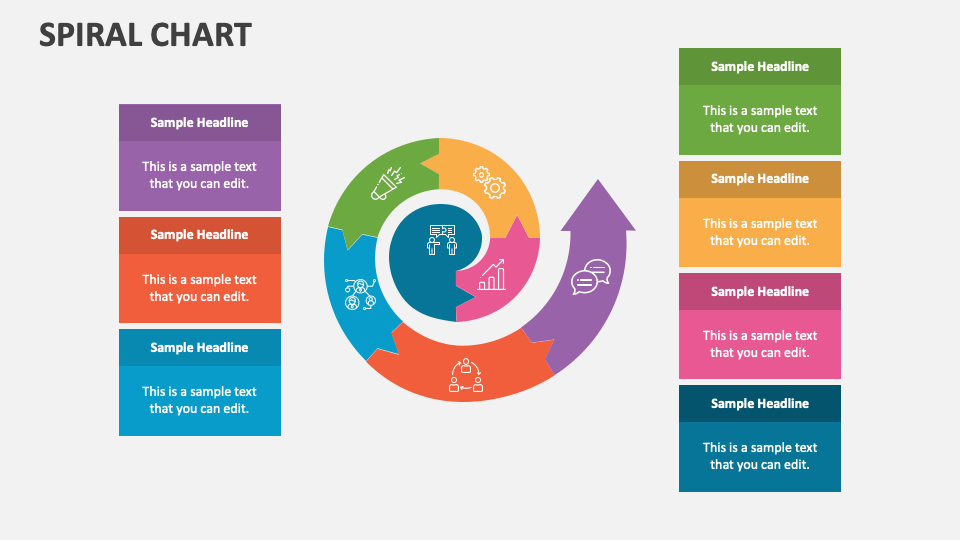
We have introduced the Spiral Chart for MS PowerPoint and Google Slides to help you present your information in a visually enticing manner. The template comprises eye-catching visuals, ideal for presentations on iterative development, growth and advancement, continuous loops in a process, and more.
Business heads can leverage this versatile deck to showcase the improvement in profitability and business growth attained in the past years. Sales and marketing professionals can capitalize on this deck to highlight the increase in sales, customer base, etc. Software developers can shed light on the stages of iterative planning. Life coaches and personal development coaches can visualize the factors that lead to growth and improvement in various aspects of a person’s life, such as career, relationships, health, and personal well-being.