
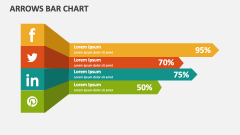
Timeline Bar Chart
In stock
$5.00
item details (7 Editable Slides)
- Applications Supported: PowerPoint, Google Slides
- File Type: .pptx, Google Slides
- Aspect Ratio:16:9 (Wide Screen)
- Animation: Yes
Timeline Bar Chart
Timeline Bar Chart
(7 Editable Slides)
Related Products

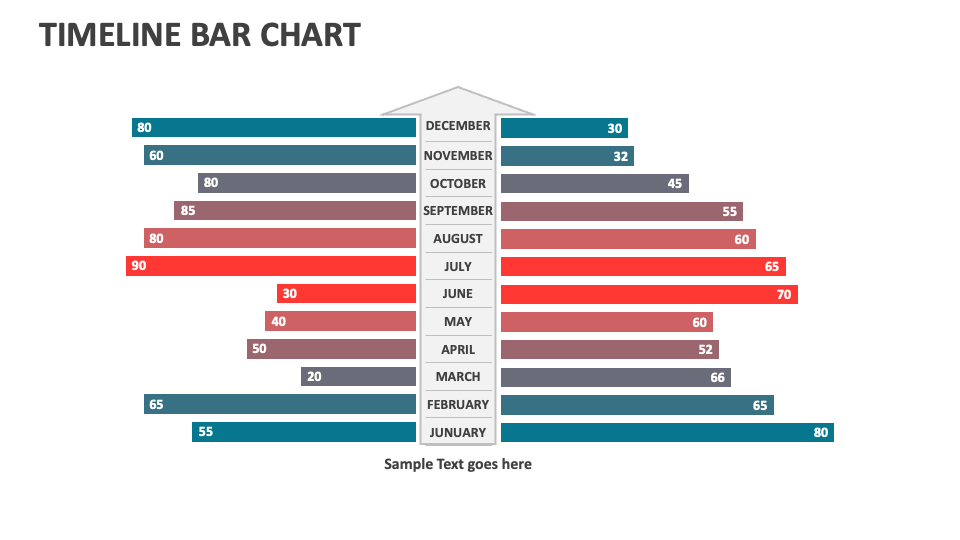
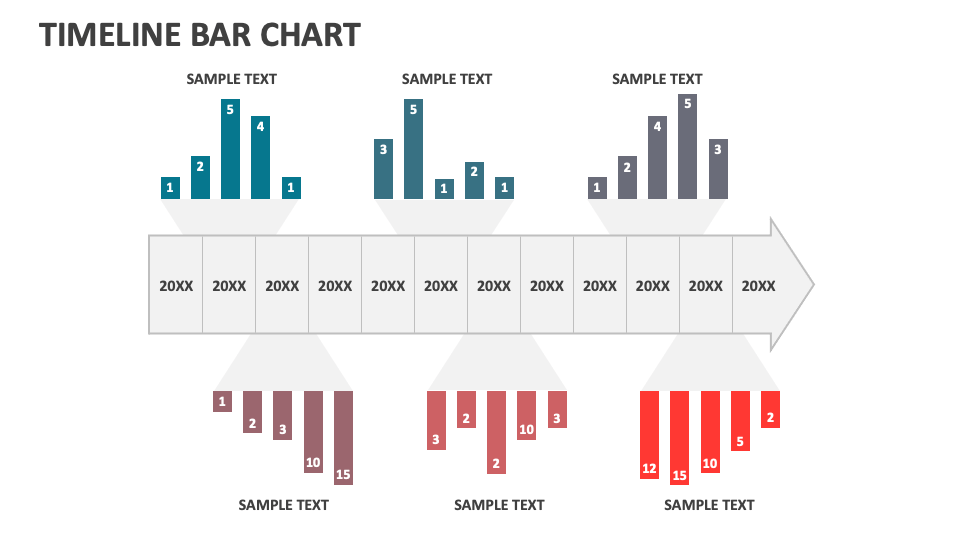
Our Timeline Bar Chart for MS PowerPoint and Google Slides is an ideal visual aid for showcasing data trends, changes in company revenue, the goals achieved, etc., over the past years or months. Customize the deck’s elements to perfection by resizing, recoloring, removing, or adding components.
Business leaders can capitalize on this versatile template to illustrate the significant growth and achievements attained over that past year. Technology heads and IT professionals can present the milestones achieved in technological development over the decades. Sales managers can shed light on the increase in customer base or sales revenue over a stipulated time frame. The deck features sample text placeholders that can be utilized to present personalized content.