
3D Puzzle Pie Chart
In stock
$5.00
item details (10 Editable Slides)
- Applications Supported: PowerPoint, Google Slides
- File Type: .pptx, Google Slides
- Aspect Ratio:16:9 (Wide Screen)
- Animation: Yes
3D Puzzle Pie Chart
3D Puzzle Pie Chart
(10 Editable Slides)


Related Products

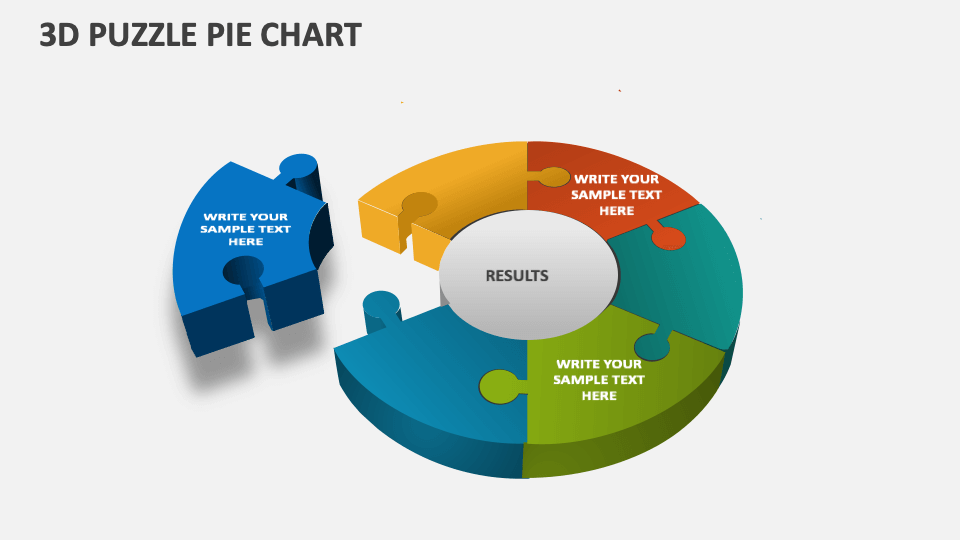
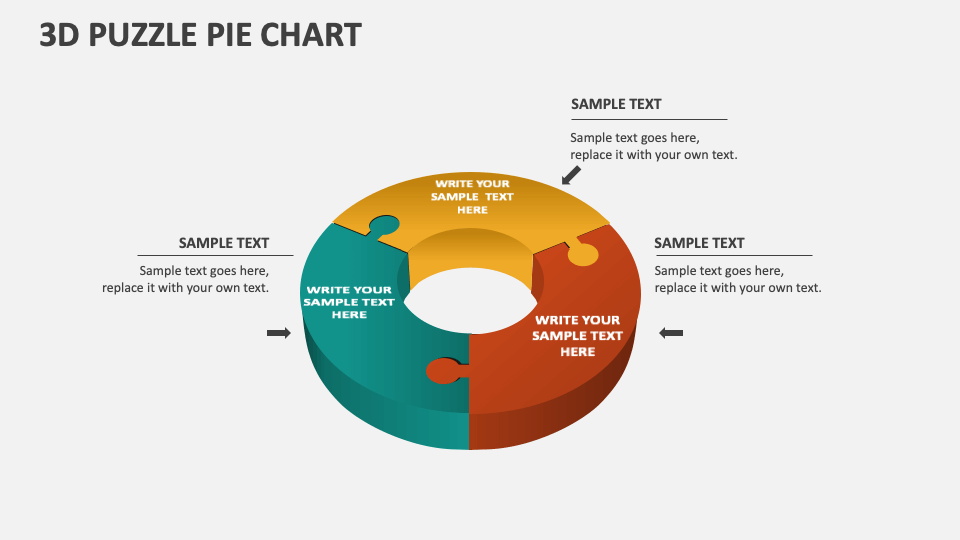
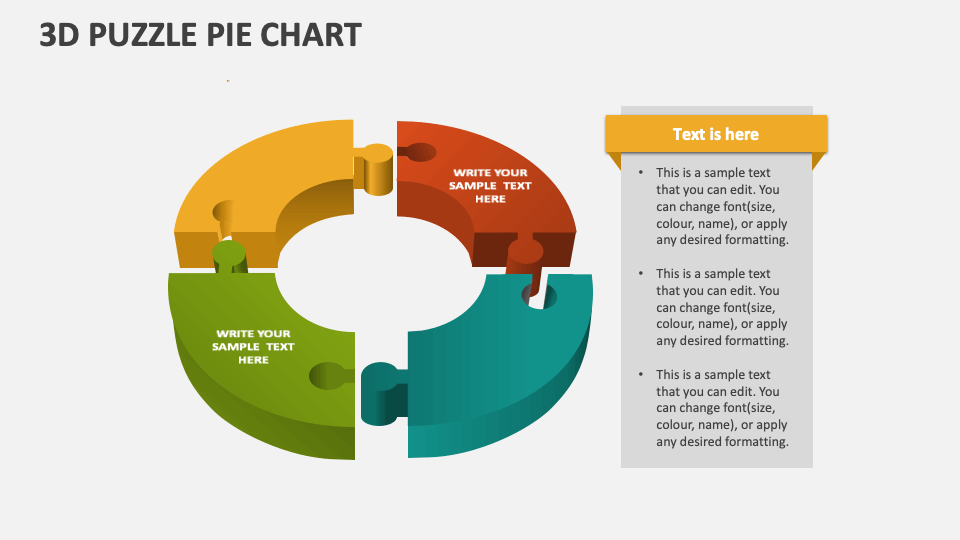
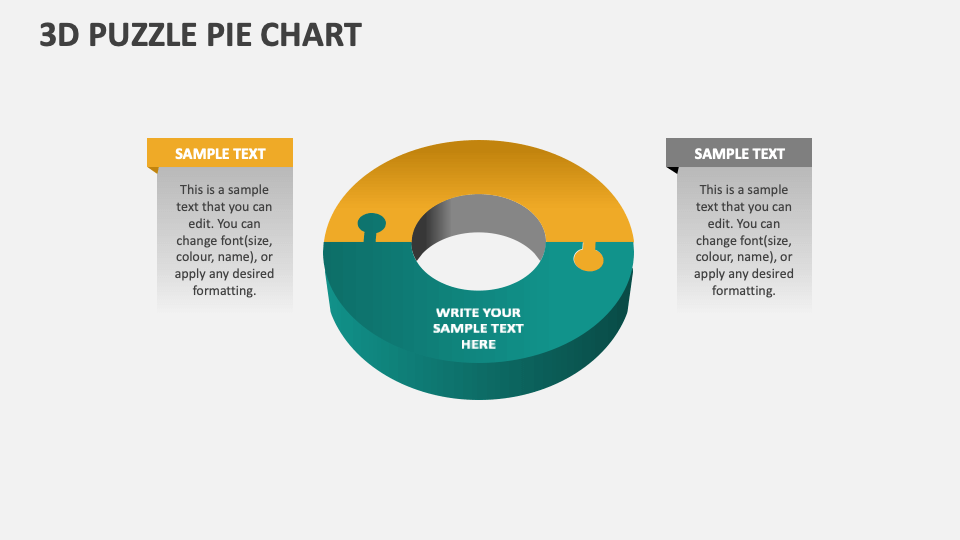
Make the most of our 3D Puzzle Pie Chart template for MS PowerPoint and Google Slides to illustrate the interconnectedness of multiple elements, different segments of the market, various marketing channels and how they collectively drive overall sales, budget allocations for a company’s departments, and more. 100% customizable slides!
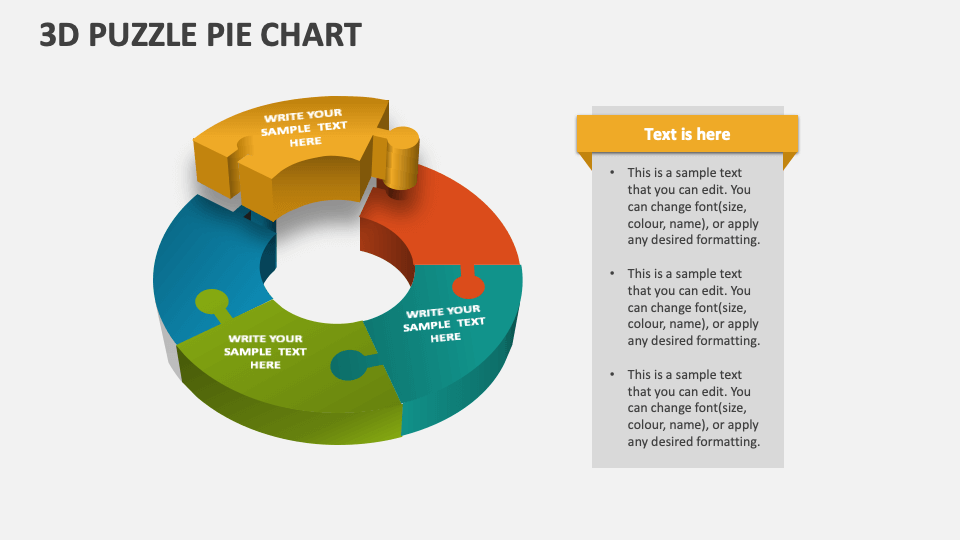
HR heads, business leaders, and senior executives can use this animated template to showcase the contributions of various teams, departments, or individuals. Product heads can shed light on the products or product lines in the company's portfolio and how each contributes to the overall revenue. IT heads can visualize the components of IT infrastructure and how they integrate to support organizational operations. Marketing heads can highlight the key elements of the marketing mix and their interrelation to create a cohesive marketing strategy.