
Puzzle Pie Chart
In stock
$5.00
item details (10 Editable Slides)
- Applications Supported: PowerPoint, Google Slides
- File Type: .pptx, Google Slides
- Aspect Ratio:16:9 (Wide Screen)
- Animation: Yes
Puzzle Pie Chart
Puzzle Pie Chart
(10 Editable Slides)

Related Products

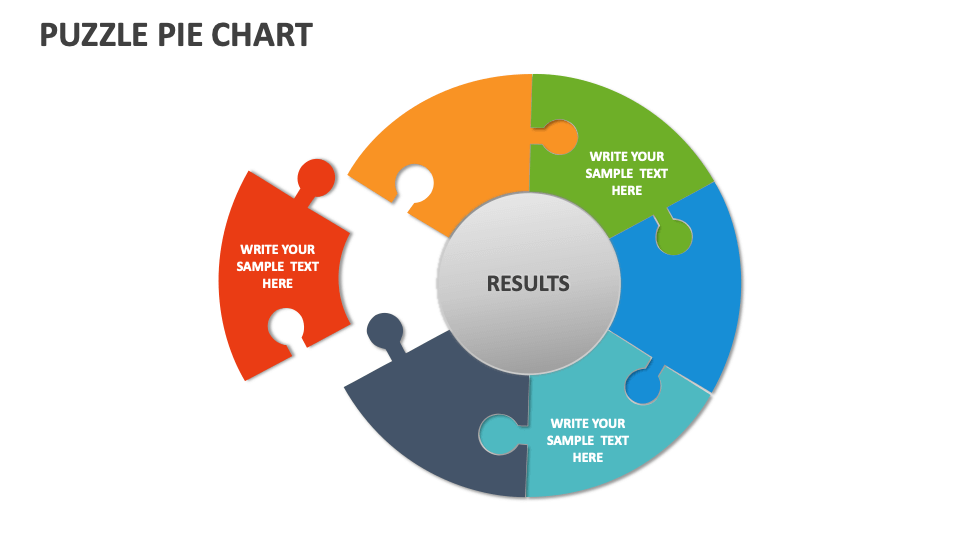
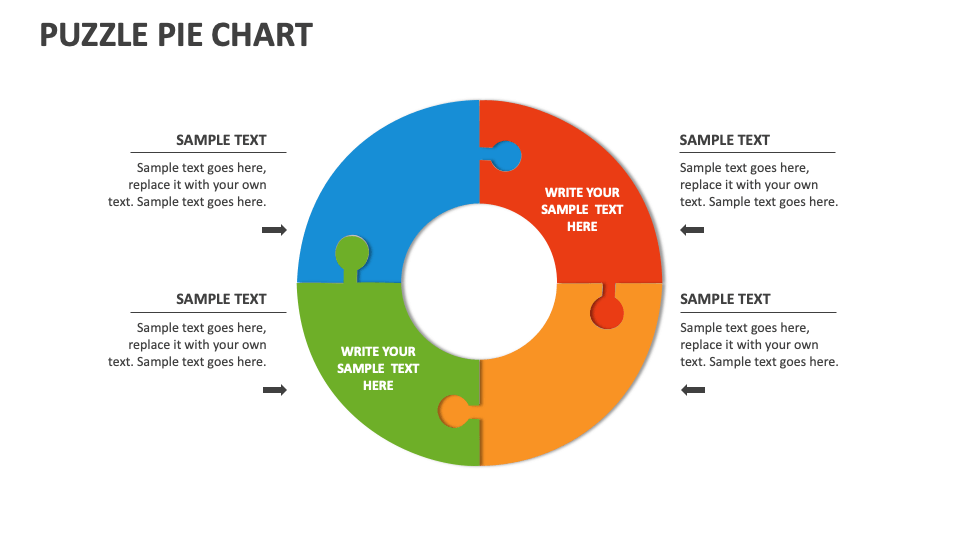
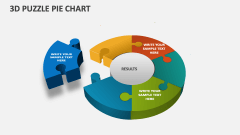
If you wish to present statistical or numerical-based information in an easy-to-understand manner, we have got you covered. Our Puzzle Pie Chart for MS PowerPoint and Google Slides is perfect for depicting market share distribution among competitors or product categories, strategic considerations or components of the decision-making process, etc.
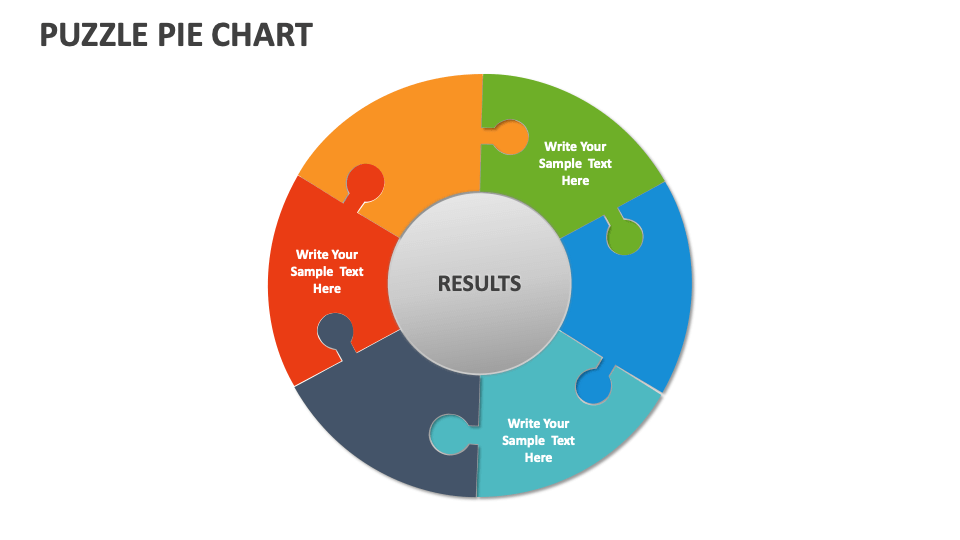
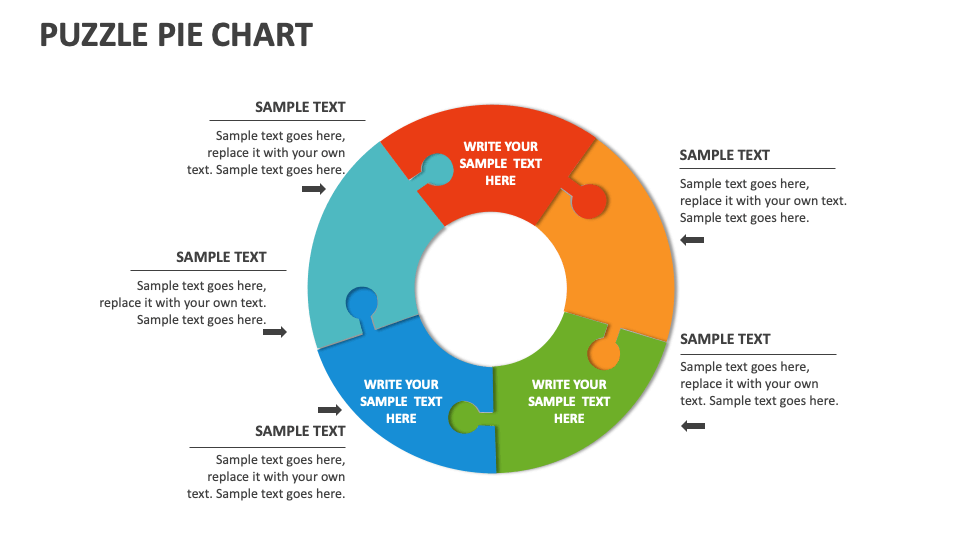
HR heads and business leaders can use this template to showcase the contributions or achievements of various teams, departments, or individuals. Project heads can visualize the budget and resources allocated for different activities in the project development phases. Sales heads can shed light on the conversion rates at multiple stages of the sales process. You can also depict how different experiences combine to shape the customer’s perception of a product or service.