
People Chart
In stock
$5.00
item details (5 Editable Slides)
- Applications Supported: PowerPoint, Google Slides
- File Type: .pptx, Google Slides
- Aspect Ratio:16:9 (Wide Screen)
- Animation: Yes
People Chart
People Chart
(5 Editable Slides)
Related Products
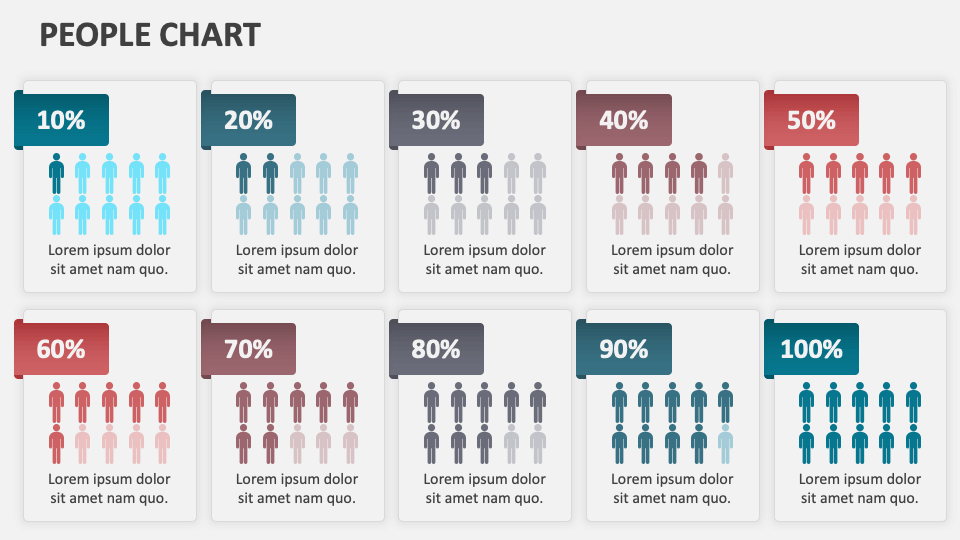
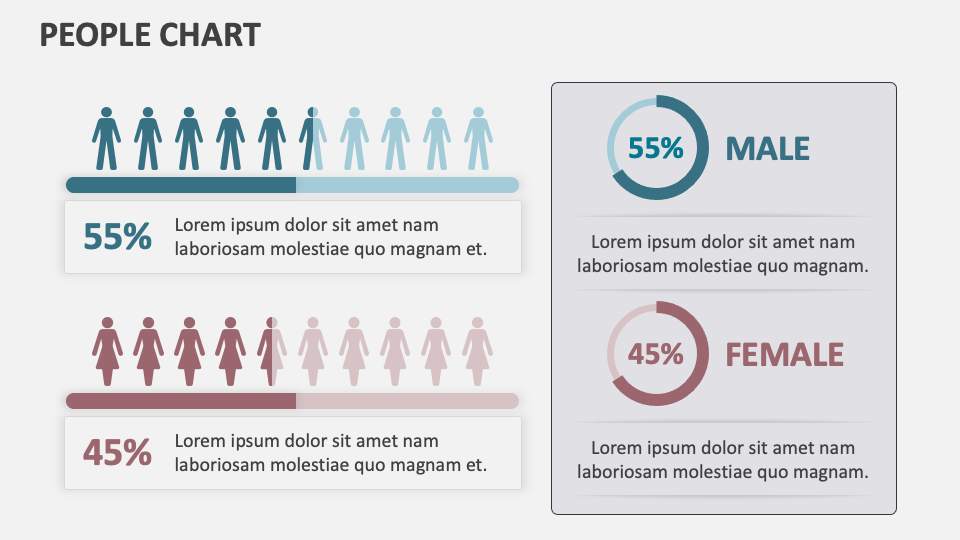
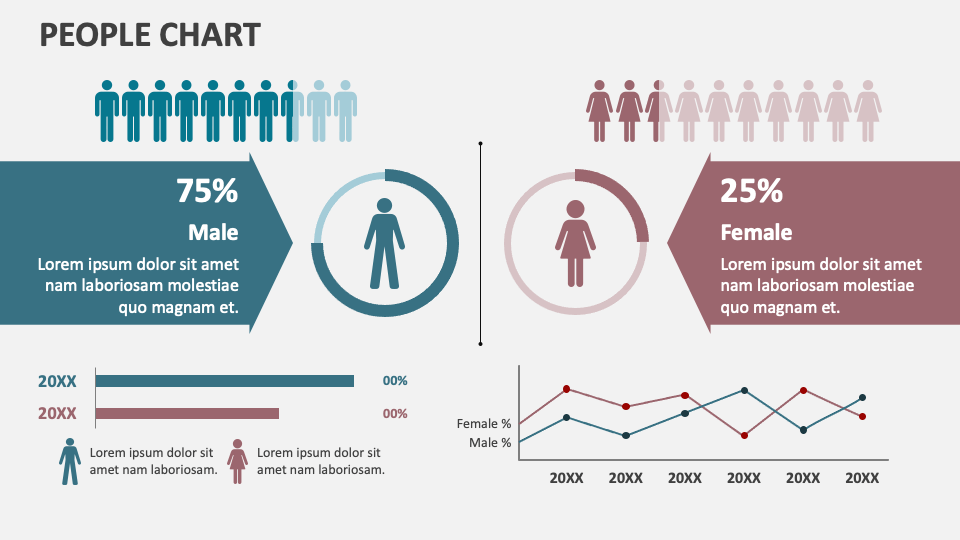
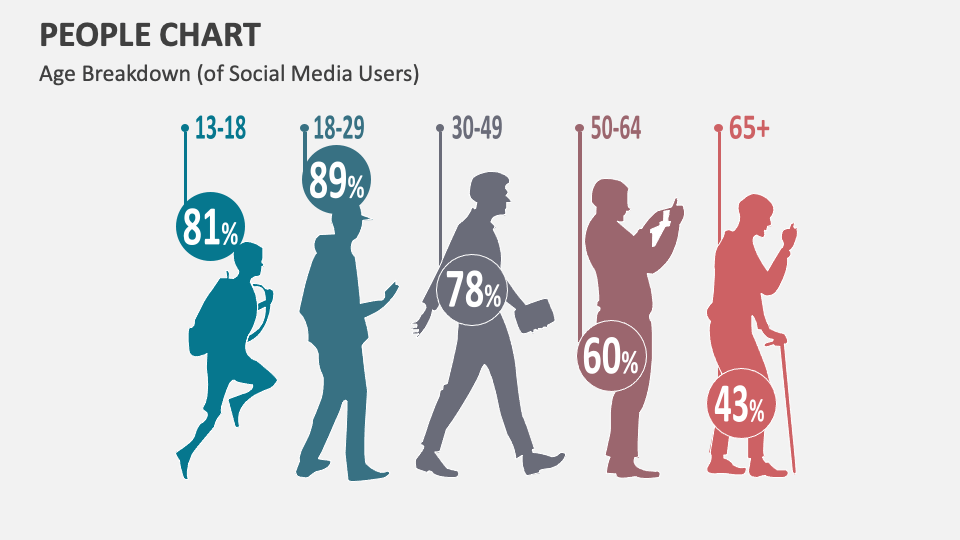
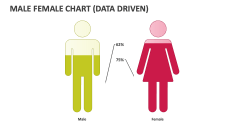
If you wish to present statistical information about male and female ratio in a meaningful and comprehensible manner, our People Chart presentation template is your best bet. Designed for MS PowerPoint and Google Slides, the deck comprises eye-catching visuals of male/female figures with percentage signs.
Digital media users can use these slides in their presentation to depict the breakup of social network users by gender, varying levels of engagement among different age demographics on social media platforms, etc. Sales heads and company owners can showcase the differences in shopping preferences and behaviors of male and female customers. HR heads can shed light on the earnings disparity between female and male employees in their firm, the traits and leadership styles of male and female leaders, etc. Election commission officials can visualize the ratio of male and female voters in a specific region.