




Stop Light Chart
In stock
$5.00
item details (6 Editable Slides)
- Applications Supported: PowerPoint, Google Slides
- File Type: .pptx, Google Slides
- Aspect Ratio:16:9 (Wide Screen)
- Animation: Yes
Stop Light Chart
Stop Light Chart
(6 Editable Slides)
Related Products
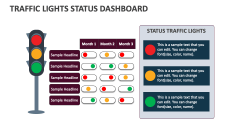


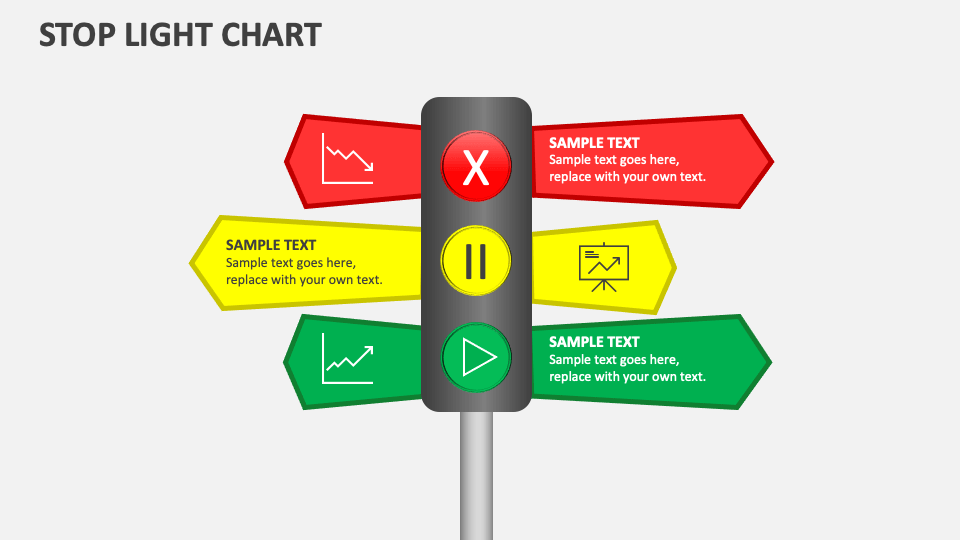
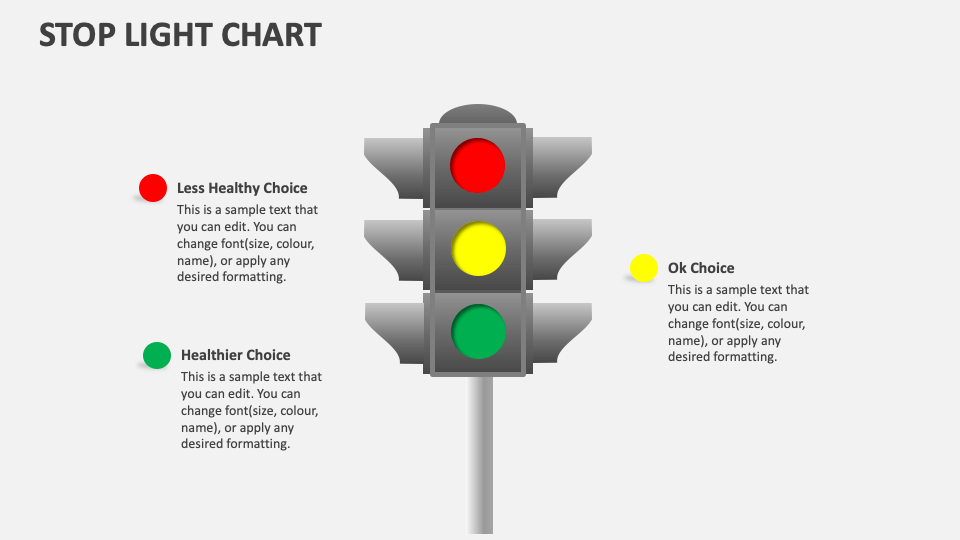
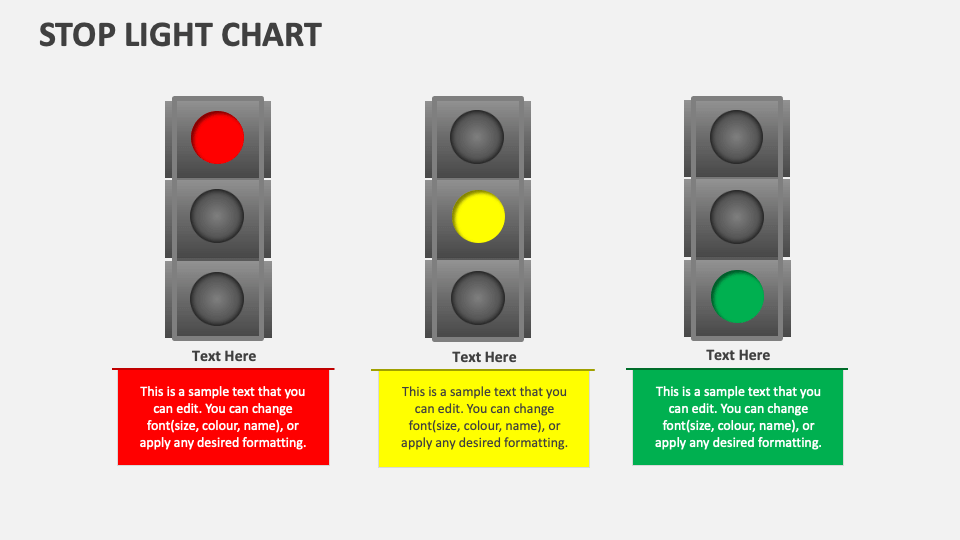
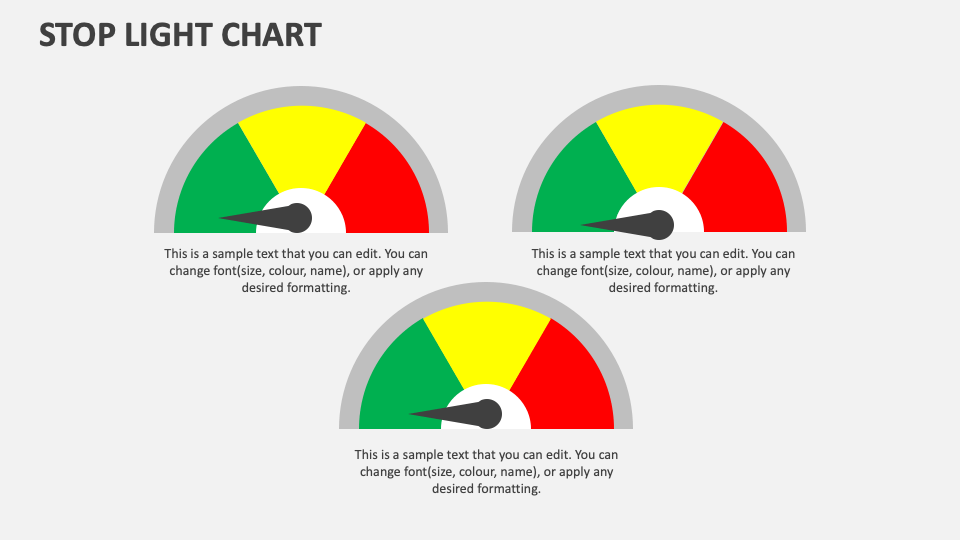
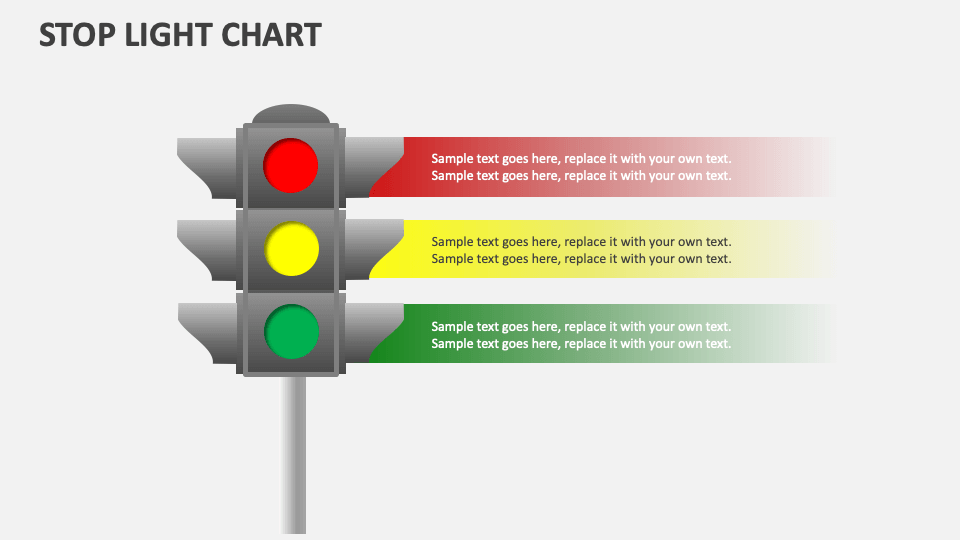
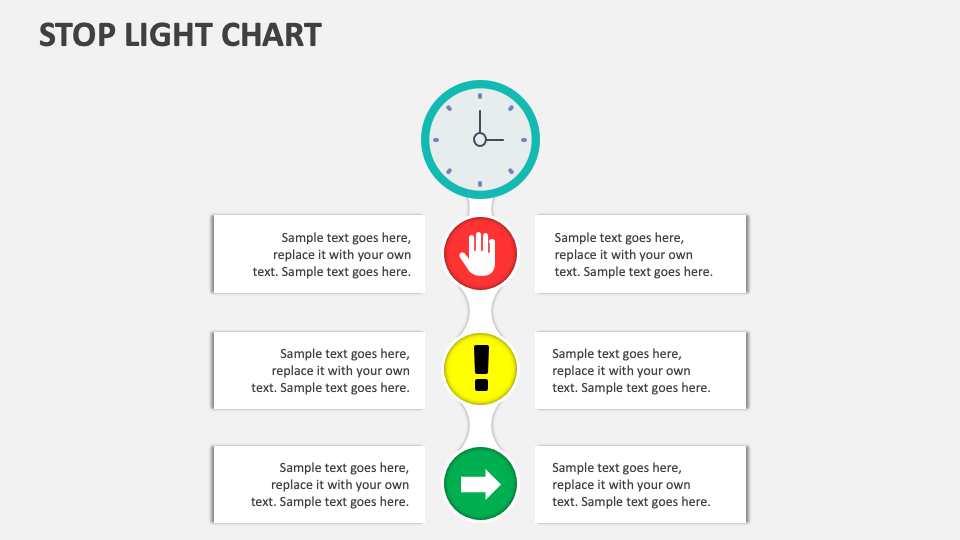
Lay your hands on our unique Stop Light Chart (Red Amber Green) presentation template to make your content more visually engaging and meaningful. Designed for MS PowerPoint and Google Slides, the deck will help you leave a more profound impression on the audience.
Project heads can use this set to shed light on the progress levels of various activities or stages of a project. Product managers can illustrate the delays or issues (red light) in product development life cycle, in progress tasks (yellow light), and successfully launched products (green light). Driving instructors, educators, and traffic police officers can demonstrate the common traffic rules and the significance of yellow, green, and red lights. Risk managers can depict the level and severity of various forms of risks.